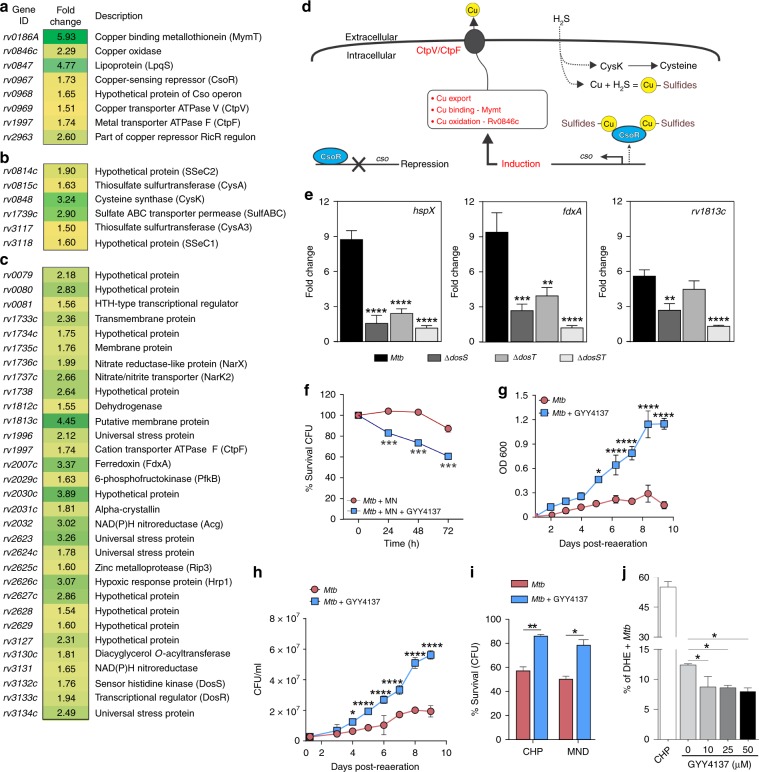
Fig. 5. H2S induces transcriptome remodeling and mitigates oxidative stress in Mtb.
RNA-seq-based gene expression analysis shows induction of the Mtb a copper, b sulfur and c Dos regulons following exposure to 25 µM GYY4137 for 1 h. Genes exhibiting ≥1.5-fold (+/–) change in expression compared to the expression in untreated cells were considered differentially regulated (n = 3 independent biological replicates per group). d Proposed model detailing the relationship between H2S and induction of the Mtb copper regulon. Exposure to H2S leads to the formation of copper sulfides, which relieve repression of CsoR leading to the export of copper via the cso. e Representative results of qRT-PCR analysis of key dormancy regulon genes following 1 h exposure to 25 µM GYY4137 in Mtb H37Rv, ΔdosS, ΔdosT and ΔdosST (n = 5 independent biological replicates per Mtb strain). Fold change in gene expression following addition of GYY4137 is shown. f Survival of Mtb cells (% CFU) exposed to metronidazole (MN) alone, or MN and 25 µM GYY4137. g Recovery profile of Mtb cells following prolonged hypoxia (8 weeks). Prior to hypoxia, one group of cells received 25 µM GYY4137. h Mean CFUs following 1 week of recovery following prolonged hypoxia. (g) and (h) represent pooled data from two or more independent experiments (n = 4). i Percentage survival (CFU) of 25 µM GYY4137-treated Mtb cells following exposure to oxidative stressors CHP and MND (0.5 mM for 6 h) relative to untreated cells. j Percent of dihydroethidium (DHE)-positive ROS-producing Mtb cells following exposure to 10−50 µM GYY4137 (spent GYY4137 used as 0 µM control; n = 3 per group). CHP treatment (15 mM) was used as a positive control for detection of ROS-positive cells. Data in (f) and (i) are representative of two or more experiments. All data are shown as mean ± SD, except (e) (mean ± SEM). Data were analyzed using one-way ANOVA (e and j) with Sidak’s multiple comparisons test, or by two-way ANOVA with Sidak’s multiple comparisons test (f−h), or by unpaired parametric t test (i). *P < 0.05, **P < 0.01, ***P < 0.001, ****P < 0.0001. Source data are provided as a Source Data file.

