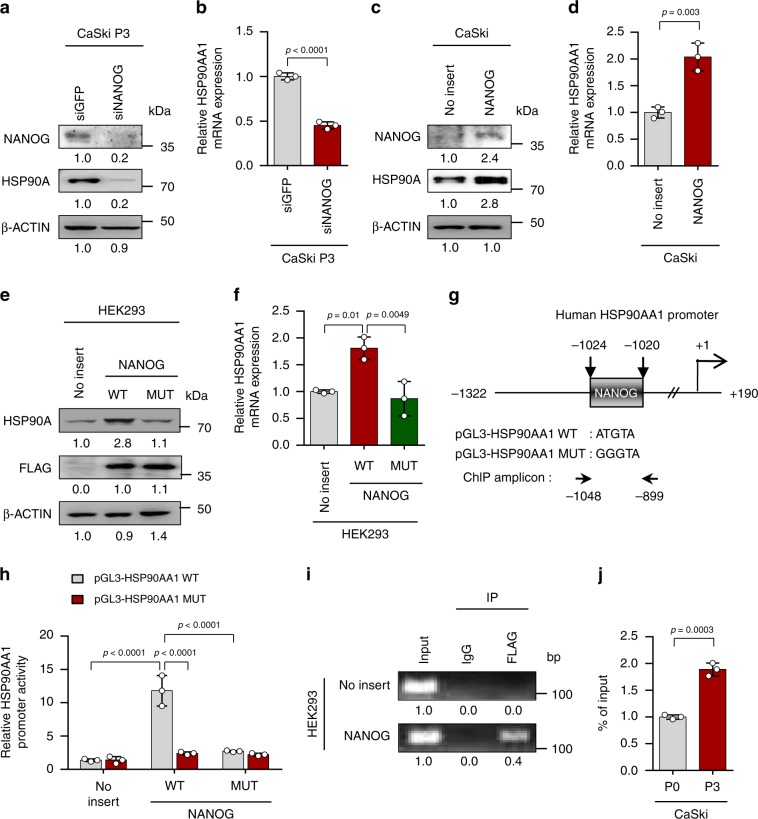
Fig. 2. HSP90AA1 expression is directly regulated by NANOG.
a and b CaSki P3 cells were transfected with siRNA-targeting GFP or NANOG. a Levels of NANOG and HSP90A protein were analyzed by Western blot. b HSP90AA1 mRNA expression was analyzed by qRT-PCR. c and d CaSki P0 cells were stably transfected with empty vector (no insert) or NANOG. c Levels of NANOG and HSP90A protein were analyzed by Western blot. d HSP90AA1 mRNA expression was analyzed by qRT-PCR. e and f HEK293 cells were transfected with empty vector (no insert), FLAG-NANOG wild type (NANOG WT) or FLAG-NANOG mutant (NANOG MUT). e Levels of HSP90A and FLAG-NANOG proteins were proved by Western blot. f HSP90AA1 mRNA expression was analyzed by qRT-PCR. g Diagram of HSP90AA1 promoter region (−1322 to +190) containing NANOG binding element. The arrows indicate ChIP amplicon corresponding to −1048 to −899. h Luciferase assay in HEK293 cells transfected with the pGL3-HSP90AA1 WT or MUT plasmid, together no insert, NANOG WT or NANOG MUT plasmids. i Chromatin immunoprecipitation assay was carried out using HEK293 cells transfected with FLAG-NANOG. Cross-linked chromatin was immunoprecipitated with anti-FLAG antibodies. Immunoprecipitated DNAs were amplified with PCR primers specific for the HSP90AA1 promoter region indicated above. Mouse IgG was used as a negative control. The input represents 2% of the total chromatin. j ChIP assay was carried out using CaSki P0 and P3 cells. Cross-linked chromatin was immunoprecipitated with anti-NANOG antibodies. The value of ChIP data represent relative ratio to the input. β-ACTIN was included as an internal loading control. Numbers below blot images indicate the expression as measured by fold change a, c, and e. All experiments were performed in triplicate. The p-values by two-tailed Student’s t test b, d and j, one-way ANOVA f or two-way ANOVA h are indicated. Data represent the mean ± SD. Source data are provided as a Source Data file.

