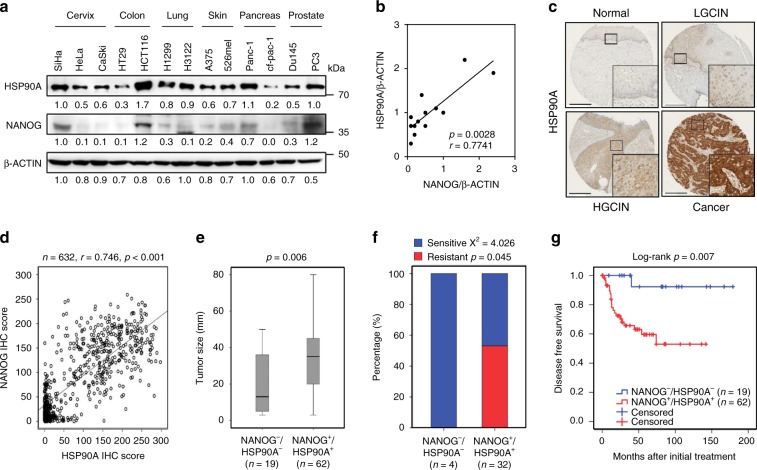
Fig. 3. NANOG–HSP90A axis is conserved across various human cancer types.
a Protein levels of NANOG and HSP90A in various human cancer cells were determined by immunoblotting. This experiment was performed in triplicate. b Correlation between NANOG and HSP90A level normalized by β-ACTIN level in various human cancer cells (Spearnan r = 0.7741, p = 0.0028). c Representative images of IHC staining of HSP90A in cervical tissue from normal (n = 328), LGCIN (n = 65), HGCIN (n = 160), and cervical carcinoma (n = 151) patients. Scale bar shown is 250 µm. LGCIN low-grade CIN; HGCIN high-grade CIN. d Correlation between NANOG and HSP90A in patients with cervical cancer (Spearnan r = 0.746, p < 0.001). e and f Combined level of NANOG+/HSP90A+ was significantly associated with large-sized tumors e and chemoradiation resistance f in patients with cervical cancer. Chemoradiation resistance was calculated only cases with available information of chemoradiation response. g Patients with NANOG+/HSP90A+ level displayed worse disease-free survival (p = 0.007) than patients with NANOG−/HSP90A− level. Cut-off value of NANOG+ and HSP90A+ are 160 and 127, respectively. The p-values were determined by Mann–Whitney U test e and f and Log-rank (Mantel–Cox) test g or spearman correlation (r) b and d. In the box plots, the top and bottom edges of boxes indicate the first and third quartiles, respectively; the center lines indicate the medians; and the ends of whiskers indicate the maximum and minimum values, respectively. Source data are provided as a Source Data file.

