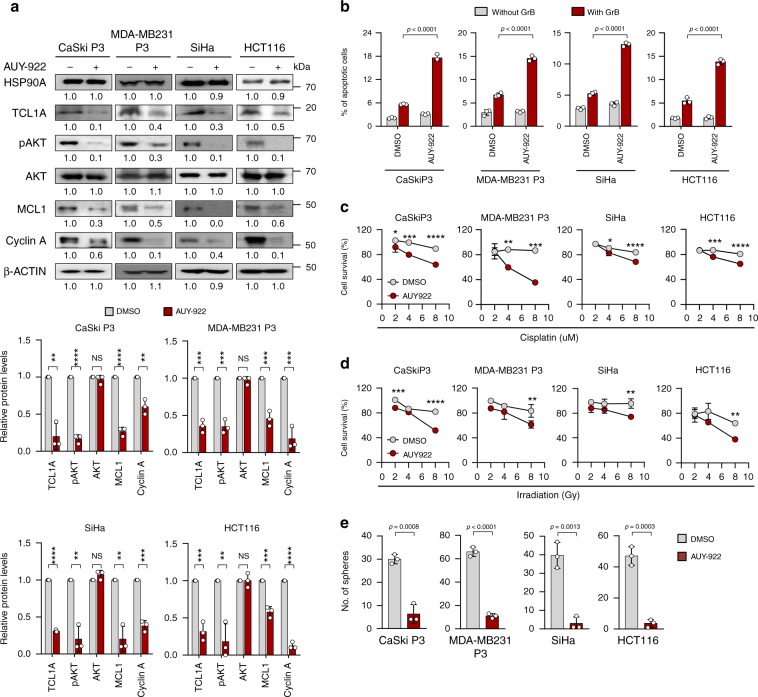
Fig. 5. HSP90A inhibition reduces multi-aggressive properties of NANOGhigh tumor cells.
a–e CaSki P3, MDA-MB231 P3, SiHa, and HCT116 cells were treated with DMSO or AUY-922. a Levels of HSP90A, TCL1A, pAKT, AKT, MCL1, Cyclin A, and β‐ACTIN were proved by Western blot. β-ACTIN was included as an internal loading control. Numbers below blot images indicate the expression as measured by fold change. Graph depicts the experimental quantitation based on at least three independent experiments. b Flow cytometry analysis of the frequency of apoptotic (active caspase-3+) cells in the cells after intracellular delivery of granzyme B for 4 h. c and d Cells were treated with indicated concentrations of cisplatin c and irradiation d. The percentage of viable cells was determined by trypan blue exclusion assay at 24 h after either drug challenge or irradiation. e Sphere-forming capacity of the cells in low-density suspension culture. All experiments were performed in triplicate. The p-value by two-tailed Student’s t test a, one-way ANOVA b and e or two-way ANOVA c and d are indicated. *p < 0.05, **p < 0.01, ***p < 0.001, ****p < 0.0001. Data represent the mean ± SD. Source data are provided as a Source Data file.

