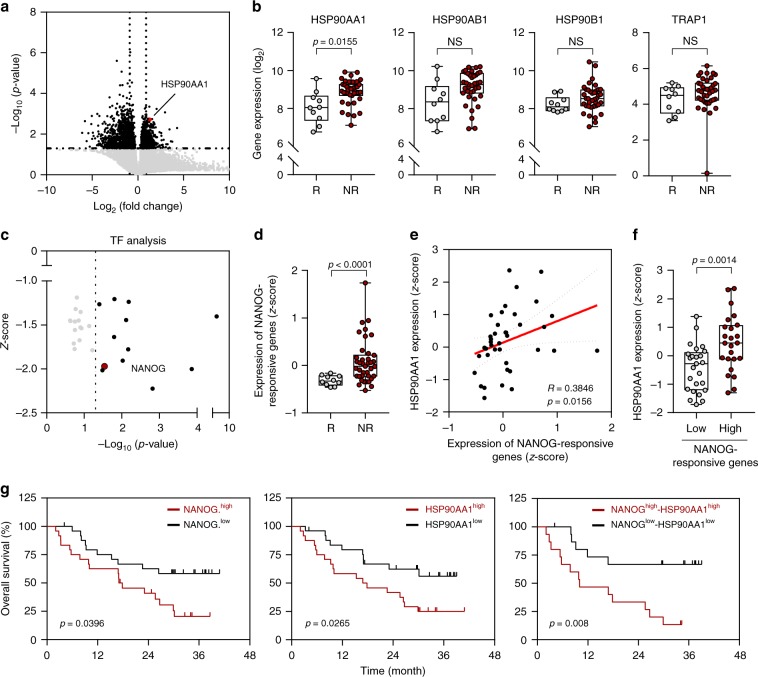
Fig. 7. NANOG–HSP90AA1 axis is associated with poor response to PD-1 blockade therapy.
a Volcano plot shows the DEGs between non-responder and responder to PD-1 blockade therapy. Colors of dots indicate significantly (black) or non‐significantly (gray) altered genes in above or below the horizontal dashed line at p = 0.05. Red dot indicates the HSP90AA1 gene. Vertical dashed lines indicate a fold change cut off (1.5FC). The p-values were determined by two-tailed test. b Comparisons of expressions levels of HSP90AA1, HSP90AB1, HSP90B1, and TRAP1 in responder (R, n = 10) and non-responder (NR, n = 39). c TF analysis of up-regulated DEGs in non-responders relative to responders to anti-PD-1 therapy. Each dot represents one TF which has transcription factor motifs enriched in DEGs. Vertical dashed line indicates p-value cutoffs at the 0.05 level. d Comparisons of expression level of NANOG-responsive genes in the responder (R, n = 10) and non-responder (NR, n = 39). e Correlation between expression level of NANOG-responsive genes and HSP90AA1 in non-responder (Spearman’s R = 0.3846, p = 0.0156). f Comparisons of HSP90AA1 expression in non-responders with low levels (Low n = 18) and high levels (High, n = 21) of NANOG-responsive genes. Error bars represent standard deviations from the mean. The p-value by unpaired t-test are indicated. g Kaplan–Meier analysis of overall survival (calculated as months to death or months to last follow-up) and median expression value cutoffs for expression level of NANOG-responsive genes (left, NANOG.high > median; NANOG.low < median, p = 0.0396) and HSP90AA1 (HSP90AA1high > median; HSP90AA1low < median, p = 0.0265, middle) and combined each (p = 0.008, right). The p-values were determined by Gehan–Breslow–Wilcoxon test. In the box plots, the top and bottom edges of boxes indicate the first and third quartiles, respectively; the center lines indicate the medians; and the ends of whiskers indicate the maximum and minimum values, respectively. Source data are provided as a Source Data file.

