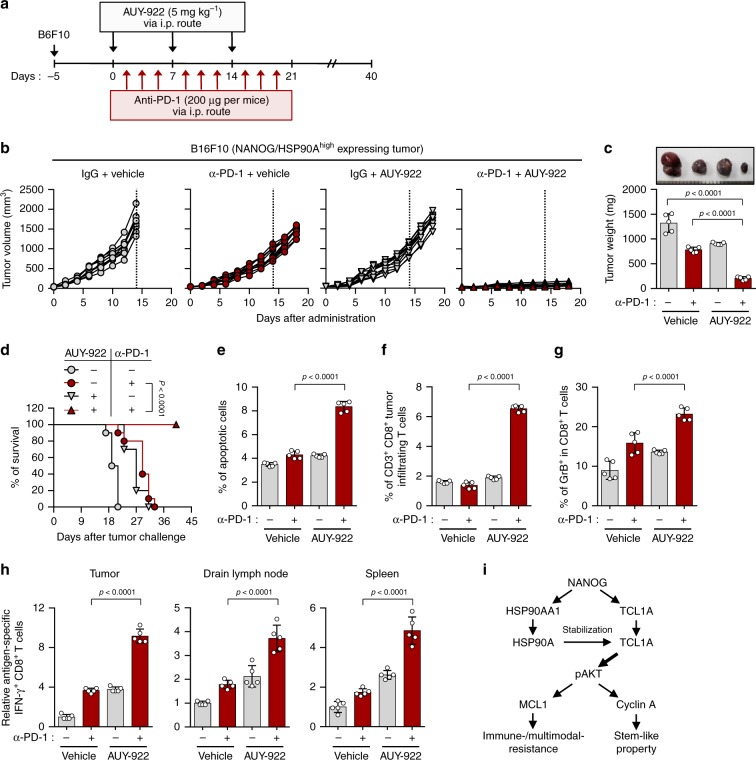
Fig. 8. HSP90A inhibition renders the tumor susceptible to anti-PD-1-mediated anti-tumor immunity.
a Schematic of the therapy regimen in mice implanted with B16F10 cells. b–h Tumor-bearing mice administered vehicle or AUY-922, with or without treatment of PD-1 antibody. b Tumor growth and c tumor mass in mice at 19 days after challenge. d Survival of mice inoculated with B16F10 cells treated with the indicated reagents. e The frequency of apoptotic cells in the tumors of vehicle-treated or AUY-922-treated mice, with or without anti-PD-1 treatment. f Flow cytometry profiles of tumor-inflitrating CD3+ and CD8+ T cells. g The ratio of Granzyme B+ to tumor-inflitrating CD3+ CD8+ T cells. h Quantification of antigen-specific CTLs in tumor (left), drain lymph node (middle), or spleen (right) derived from the tumor-bearing mice. i Schematic interpretation of the molecular mechanism by which NANOG–HSP90A–TCL1A axis promotes multi-modal-resistance and stem-like property of immune-refractory tumor cells. Numbers below blots indicate the expression as measured by fold change. For in vivo experiments, 10 mice from each group were used. The p-value by one-way ANOVA c and e–h or Log-rank (Mantel–Cox) test d is indicated. Data represent the mean ± SD. Source data are provided as a Source Data file.

