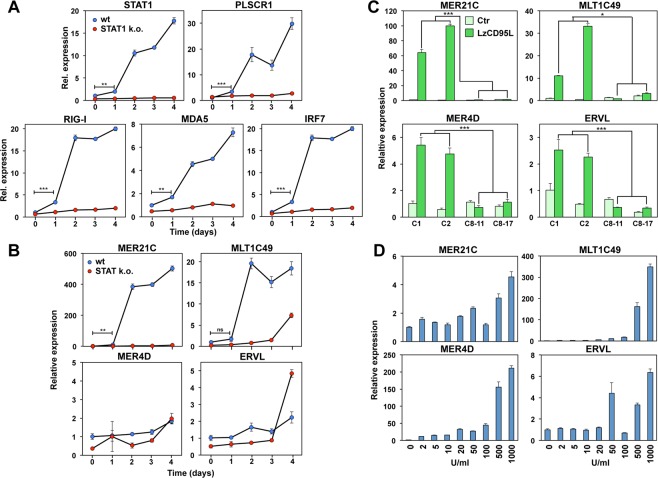
Figure 5.
Long-term stimulation of CD95 induces upregulation of endogenous retroviruses. (A) Real time PCR analysis of mRNAs of STAT1, PLSCR1, RIG-I, MDA5, and IRF7 of Cas9 control (wt, clone C1) and STAT1 k.o. MCF-7 cells (clone S1–6) after 0, 1, 2, 3 or 4 days treatment with LzCD95L. Error bars represent the SD of three biological replicates. Student’s t-test was performed to compare gene expression between 0 and 1 days treatment in wt samples. (B) Real time PCR analysis of selected ERVs MER21C, MLT1C49, MER4D, and ERVL of Cas9 control (wt, clone C1) and STAT1 k.o. cells (clone S1–6) after 0, 1, 2, 3 or 4 days treatment with LzCD95L. Error bars represent the SD of three biological replicates. Student’s t-test was performed to compare gene expression between 0 and 1 days treatment in wt samples. (C) Real time PCR analysis of selected ERVs in two Cas9 control clones (C1 and C2) and two caspase-8 k.o. clones (C8–11 and C8–17) after 4 days treatment with LzCD95L. Error bars represent the SD of three biological replicates. Student’s t-test was performed to compare gene expression between the average of LzCD95L treated control and two caspase-8 k.o. clones. (D) Real time PCR analysis of selected ERVs of MCF-7 cells after 4 days or treatment with different concentrations of IFNβ. Error bars represent the SD of four biological replicates. p-value *<0.05, **<0.001; ***<0.0001; ns, not significant.

