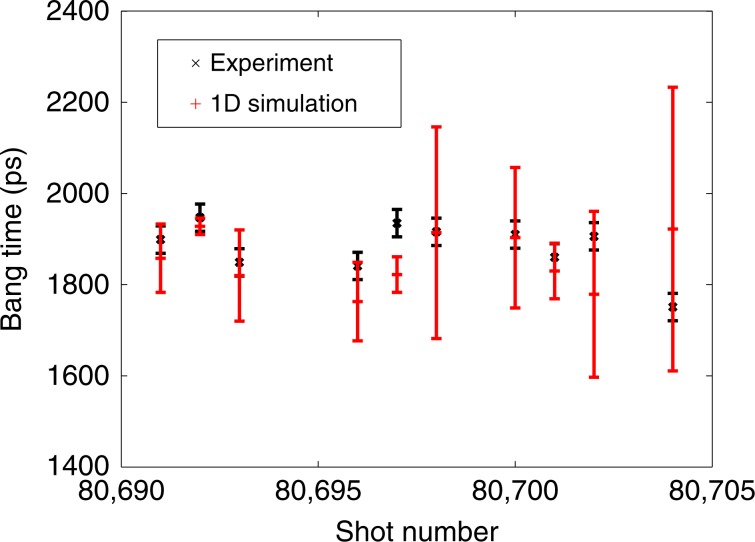
Fig. 2. Comparison of simulated and experimental bang times.
Bang times (time of peak neutron production) for all ten capsule implosions compared to 1D simulation results. 1D simulations account for variations in HT fill pressure, as-shot laser power history, and capsule ablator thickness. The simulation error bars indicate the effect of measured ablator thickness variances, which ranged from 0.5 to 8.7 μm; the average ablator thickness varied from 22.0 to 26.2 μm. The simulated error bars were calculated based on the standard deviation of 1D simulations performed at the extremes of measured ablator thickness and ablator thickness variances. The experimental bang times were determined from a neutron temporal diagnostic and the error is based on the response time of this instrument61.

