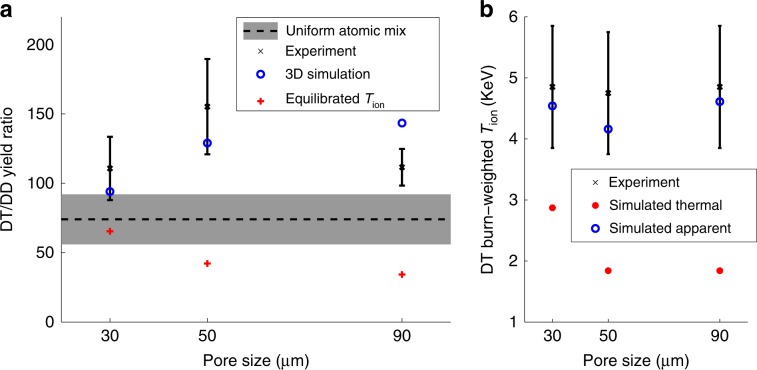
Fig. 3. Comparison between 3D simulations and experiments.
a DT∕DD reaction yield ratios corrected for as-shot variations. The black ‘x' symbols denote the experimental values with the solid black lines indicating the experimental measurement error, determined based on the method described in ref. 62. The black dashed line indicates the maximum theoretical yield ratio (Eq. (3)) for uniform atomic mix and the shaded region indicates uncertainty. This uncertainty is the maximum and minimum possible values calculated based on measurement uncertainties of foam densities, foam composition, fill pressure, and fill gas composition. Measurement errors are quantified in the Methods section and described in42–44,63–65. The red plus symbols indicate values that would have resulted from simulations if the reactants were in thermal equilibrium. b Comparison of experimental burn-weighted Ti, simulated thermal burn-weighted Ti from 3D simulations, and simulated apparent (including fluid motion corrections based on ref. 66) burn-weighted Ti from 3D simulations. A forward-fit approach using a relativistic energy distribution is used to analyzed the neutron time-of-flight signal to infer the neutron-average ion temperature, and the error bars are determined from the statistical uncertainty in this fit to the data67.

