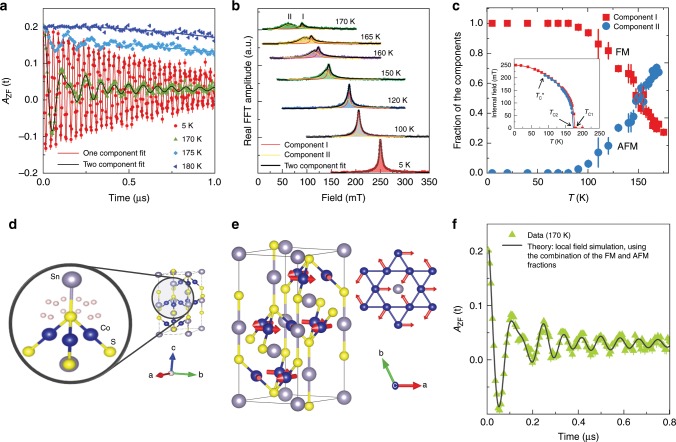
Fig. 3. Phase separation between two distinct magnetically ordered regions in Co3Sn2S2.
a Zero-field spectra, recorded at temperatures above and below TC. The solid lines are the fit of the data using Eq. (2). Error bars are the s.e.m. in about 106 events. The error of each bin count n is given by the s.d. of n. The errors of each bin in A(t) are then calculated by s.e. propagation. b Fourier transform amplitudes of the oscillating components of the μSR time spectra as a function of temperature. c The temperature dependences of the relative volume fractions of the two magnetically ordered regions. Inset shows the temperature dependences of the internal magnetic fields for the two components. Arrows mark the critical temperatures TC1 and TC2 for high frequency and low-frequency components, respectively as well as the transition temperature , below which only one component signal is observed. The error bars represent the s.d. of the fit parameters. d Crystallographically equivalent muon stopping sites with the Wyckoff position 36i within the structure of CoSn2S2. e In-plane antiferromagnetic structure. Grey solid lines indicate the boundaries of a single unit cell of the crystal structure. f μSR spectrum, recorded at 170 K, is shown along with the result of the local field simulation (black solid line) at the muon stopping site, considering two distinct magnetically ordered regions with out-of-plane and in-plane magnetic configurations, respectively.

