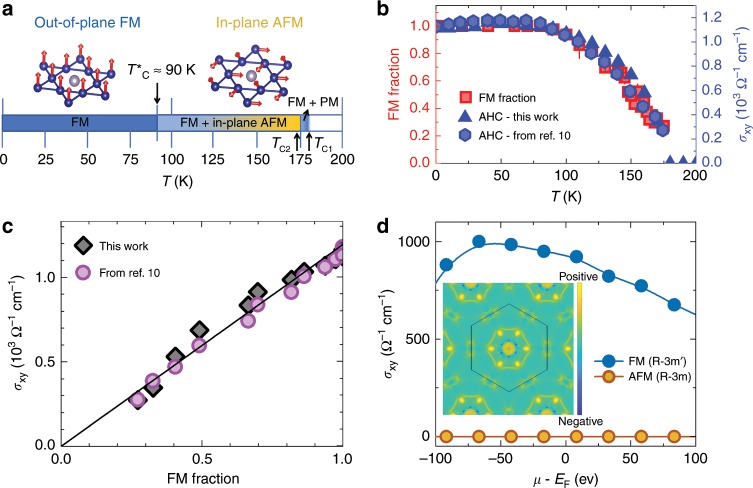
Fig. 4. Magnetic competition driven thermal evolution of anomalous Hall conductivity.
a Schematic magnetic phase diagram as a function of temperature and spin structures of Co3Sn2S2, i.e. the FM and the in-plane AFM structures. The arrows mark the transition temperatures TC1 ≃ 177 K, TC2 ≃ 172 K and ≃ 90 K. b The temperature dependence of the FM volume fraction and the in-plane anomalous Hall conductivity σxy. The error bars of the FM fraction represent the s.d. of the fit parameters. c The correlation plot of σxy vs fraction of the ferromagnetically ordered region. The solid straight line is drawn between a hypothetical situation of the minimum (zero) and the maximum values of σxy and the FM fraction. Data shown in solid circles are taken from ref. 10. d The dependence of σxy on the chemical potential, calculated for the out-of-plane FM and the in-plane AFM structures. The inset shows the calculated Berry curvature distribution in the BZ at the Ferromagnetic phase.

