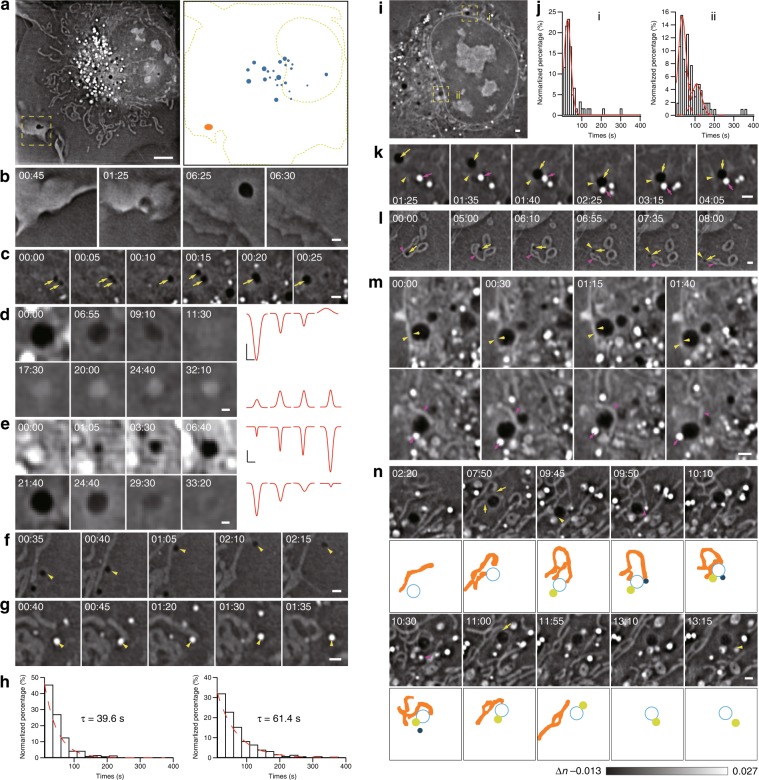
Fig. 5. Visualization of the trafficking routes of DBs and their role in organizing the organelle interactome.
a One Z plane of the COS-7 cell is shown at the time point of 00:49:30 (left), while the corresponding schematic diagram shows the distributions of DBs close to the nuclear membrane (blue) and the plasma membrane (orange, right). b A representative example of a large DB formed in the cell periphery due to pinocytosis. c A representative example of two sequential DB–DB fusion events. Arrows indicate DBs. d A representative example of the transformation of the DB into an LE/LY in a COS-7 cell is shown on the left, while the corresponding intensity profiles at different time points approximated by the Gaussian function are shown on the right. e A representative example of the biogenesis of a DB in the region close to the nuclear membrane (top), followed by fusion of the DB to the plasma membrane ~27 min later (bottom). Montages of the DB at different time points are shown on the left, while the corresponding intensity profiles at different time points approximated by the Gaussian function are shown on the right. f, g A representative example of a DB–mitochondrion (f, the arrowhead indicates the DB) or LD–mitochondrion (g, the arrowhead indicates the LD) contact. h Distribution of the durations of LD–mitochondrion contacts (left) and durations of DB–mitochondrion contacts (right). i One cell with DB–nuclear membrane contacts in sparsely (i) and densely (ii) populated perinuclear regions. j Histograms of contact times between DBs and the nuclear membrane in sparsely (left) and densely (right) populated regions. k A representative example of a multiorganelle complex formed by collision of a DB (yellow arrows) with a contact formed by the tubular ER (yellow arrowheads) and an LD (magenta arrows). l Another representative example of a multiorganelle complex formed by a DB (yellow arrows), a mitochondrion (magenta arrowheads), and the tubular ER (yellow arrowheads). m A representative example of a DB bridging different organelles. The same DB (yellow arrows) interacted with the nuclear membrane (yellow arrowheads) in one Z plane (upper panel) and simultaneously with both an LD (magenta arrows) and a mitochondrion (magenta arrowheads) in the Z plane 0.68 μm away (lower panel). n Montage of a representative example of a DB that sequentially interacted with a mitochondrion (yellow arrows), an LY (yellow arrowhead), and an LD (magenta arrowhead) to form the DB–mitochondrion–LD–LY quaternary complex, followed by the disassociation of the LD, the mitochondrion and the LY one-by-one. Schematic diagrams are shown below the ODT images to better demonstrate the process. Scale bars: (a) 5 μm and (b–g, i, k–n) 1 μm.

