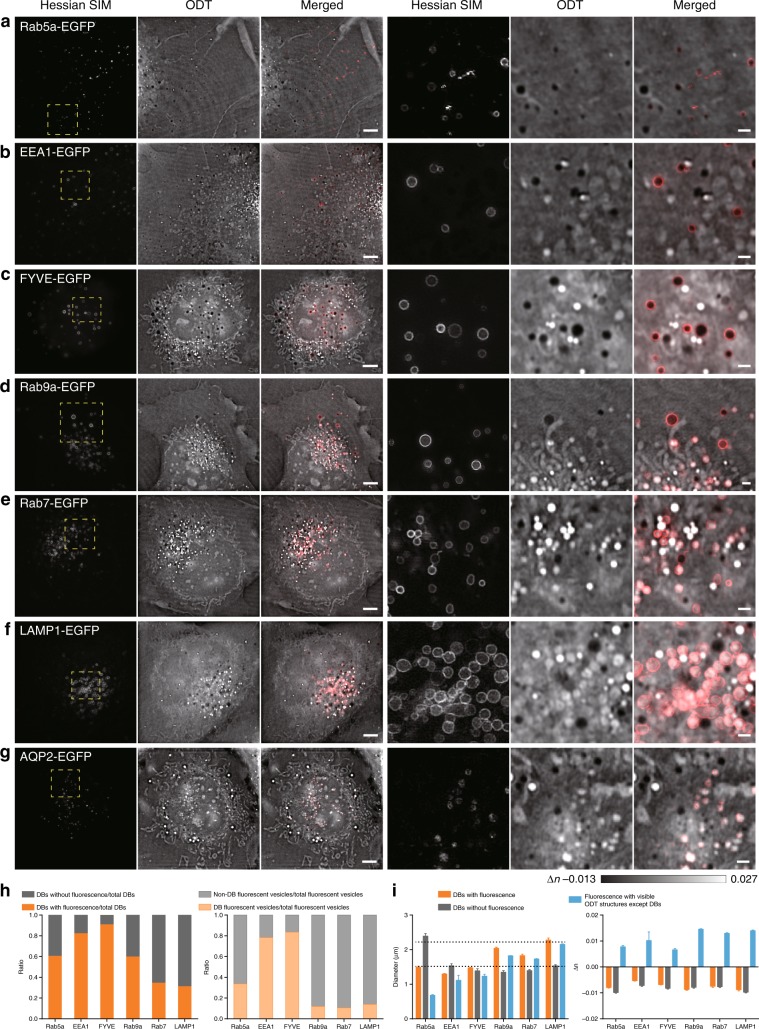
Fig. 6. DBs exhibited an overall distinct profile from that of conventional endosomal compartments, despite some shared protein markers.
The regions enclosed by the dashed yellow boxes on the left are enlarged on the right. a–f Representative examples of the colocalization of DBs with Rab5a-EGFP- (a), EEA1-EGFP- (b), FYVE-EGFP- (c), Rab9a-EGFP- (d), Rab7-EGFP- (e), LAMP1-EGFP- (f), and AQP2-EGFP- (g) labeled vesicles. h Left: proportions of DBs associated with fluorescent Rab5a/EEA1/FYVE/Rab9a/Rab7/LAMP1 within the total pool of DBs are shown in orange, while those without fluorescence labeling are shown in gray. Right: proportions of DBs associated with Rab5a/EEA1/FYVE/Rab9a/Rab7/LAMP1 within the total pools of the respective fluorescent vesicles are shown in orange, while those of non-DB fluorescent vesicles within the total pools of the respective fluorescent vesicles are shown in gray. i Left: diameters of DBs with (orange) and without (gray) fluorescent labeling and fluorescent vesicles with visible ODT structures except DBs (blue). Right: differences in RIs between cellular structures and their surrounding environments, which include DBs with (orange) and without (gray) fluorescent labeling and fluorescent vesicles with visible ODT structures, except DBs (blue). Scale bars, (a–g) 5 μm (left) and 1 μm (right).

