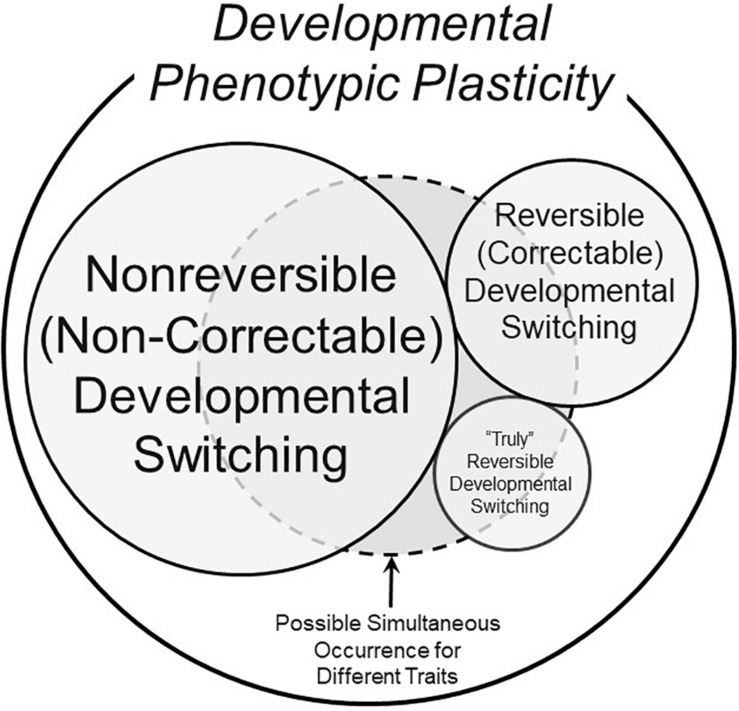
FIGURE 3.
A schematic of possible components of the overall phenomenon of developmental phenotypic plasticity. This Venn diagram makes the assumption that not all phenotypic changes induced by stressors during developmentally critical windows are non-reversible (non-correctable) – see text for further discussion of definitions. The different sizes of the circles and text are meant to convey the very approximate prevalence of the form of developmental switching. The dashed circle represents the fact that all three types of developmental phenotypic switching could occur simultaneously in an animal, each for a different trait.

