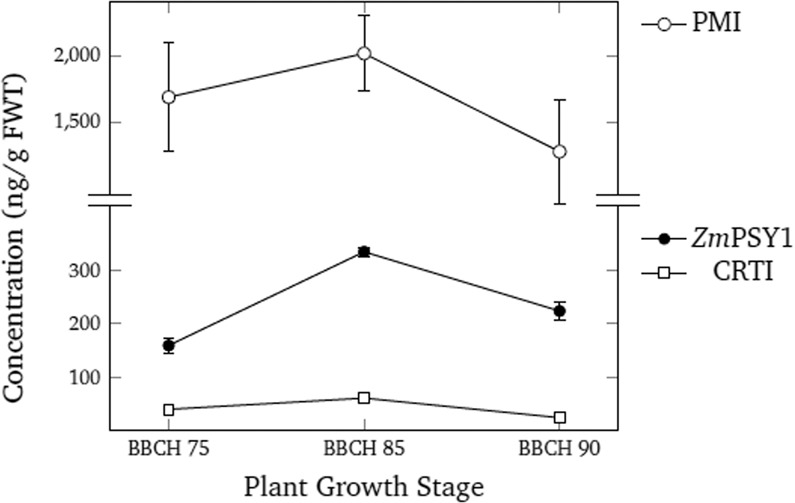
Figure 3.

Samples of GR2E grain were collected at different developmental stages [BBCH 75 (milk stage), BBCH 85 (dough stage), and BBCH 90 (mature stage)] from four locations over two growing seasons in 2015–16 and the concentrations of ZmPSY1, CRTI, and PMI were determined by quantitative ELISA and are given in ng g/fresh weight tissue (FWT). Values represent the mean concentration across locations and years for each protein, and the error bars represent the range of concentrations measured across locations over both growing seasons. In some cases, the size of the error bars was less than the symbol size used for plotting (adapted from GR2E-FFP submitted study reports).
