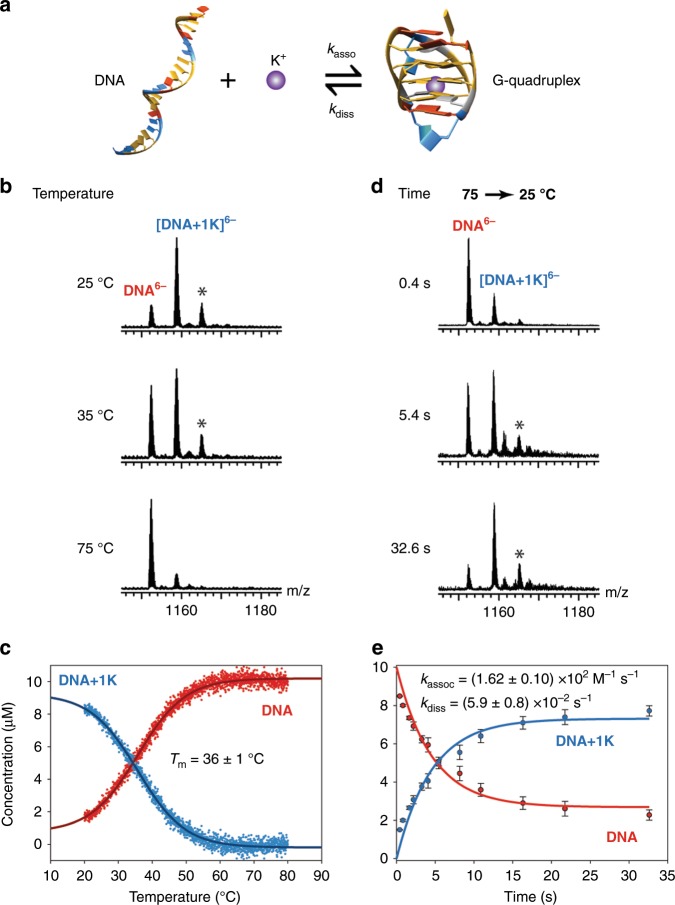
Fig. 2. Kinetics of G-quadruplex formation.
a Representation of the chemical equilibrium of binding of K+ to the DNA sequence 22CTA (d(A(GGGCTA)3GGG), PDB ID: 2KM345). b, c Thermal denaturation of 22CTA–K+, monitored by MS (10 µM DNA in 100 mM TMAA and 1 mM KCl). d, e Kinetics recorded using the T-jump ESI source (jump from 75 to 25 °C). The mass spectra are magnified views of the 6- charge state. The peaks labeled with a star correspond to a nonspecifically bound K+ ion. c, e Quantification of the species taking into account nonspecific adducts as described previously47,48. The 5- and 6- charge states were averaged. The vertical error bars in e are the standard deviation obtained from the quantification on different charge states (5- and 6-, n = 2). The reproducibility of the experiment is discussed in the Discussion section. The errors on the rate constants are the standard deviations from the fitting. Source data are provided as a Source Data file.

