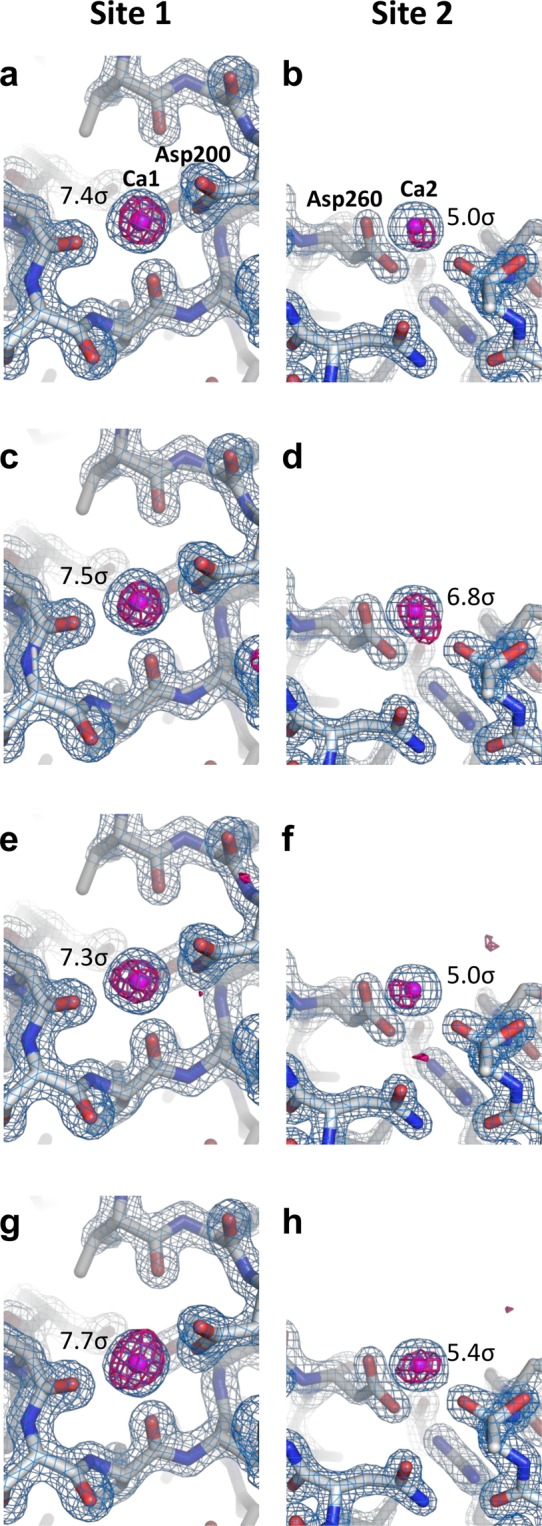
Figure 2.

Electron density maps of proteinase K. Close-up views of calcium ion binding sites with 2Fo–Fc electron density maps contoured at the 2.0 σ level (coloured blue) for (a,b) paraffin grease, (c,d) DATPE grease, (e,f) nuclear grease and (g,h) cellulose matrices. Bound calcium ions are depicted as magenta spheres. The anomalous difference Fourier maps using 20,000 indexed images (contoured at the 3.5 σ level) are shown in red. The anomalous peak heights obtained from ANODE are displayed in figures. These figures were drawn with PyMol (http://www.pymol.org).
