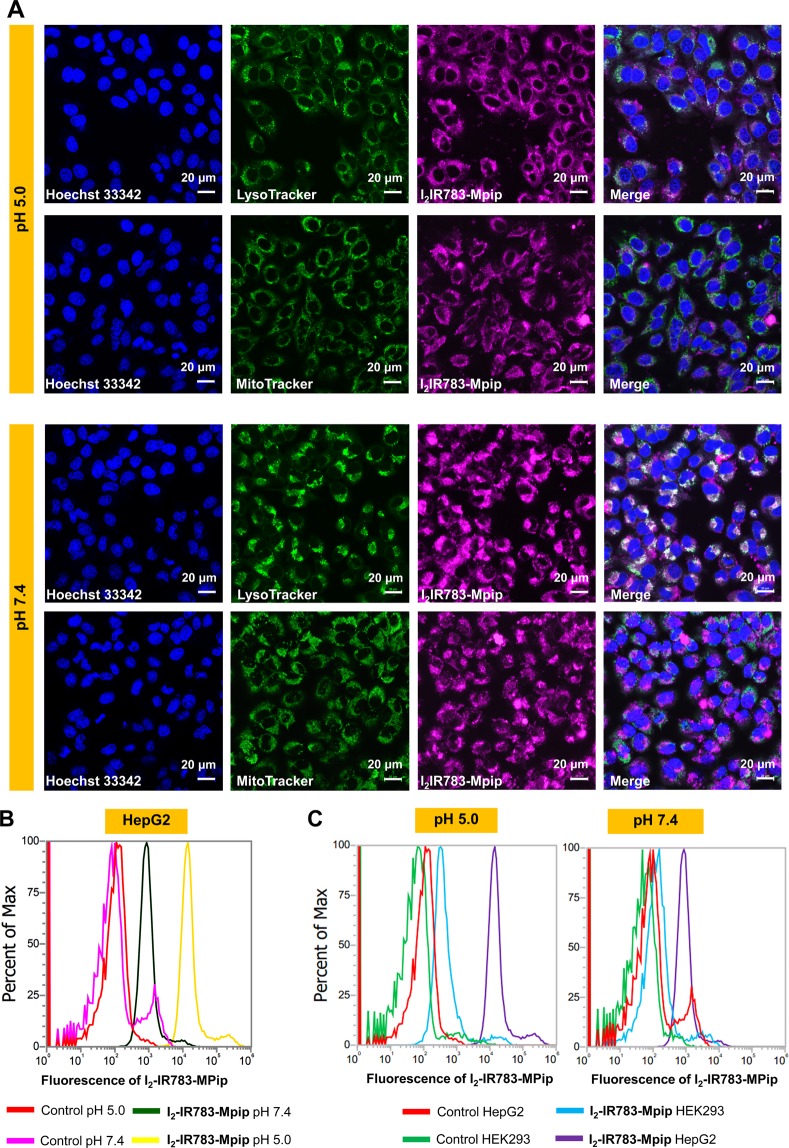
Figure 3.
(A) Confocal images of HepG2 cells incubated with 30 μM of I2-IR783-Mpip for 6 h and colocalization of I2-IR783-Mpip with LysoTracker green (Pearson’s R value = 0.68 in pH 5.0 and 0.68 in pH 7.4) and MitoTracker Green (Pearson’s R value = 0.31 in pH 5.0 and 0.45 in pH 7.4). (B) Flow cytometry of HepG2 cells incubated with 15 μM of I2-IR783-Mpip for 12 h in culture media pH 5.0 and 7.4. (C) Flow cytometry of HepG2 and HEK293 cells incubated with 15 μM of I2-IR783-Mpip for 12 h in culture media pH 5.0 and 7.4. Scale bars = 20 μm.

