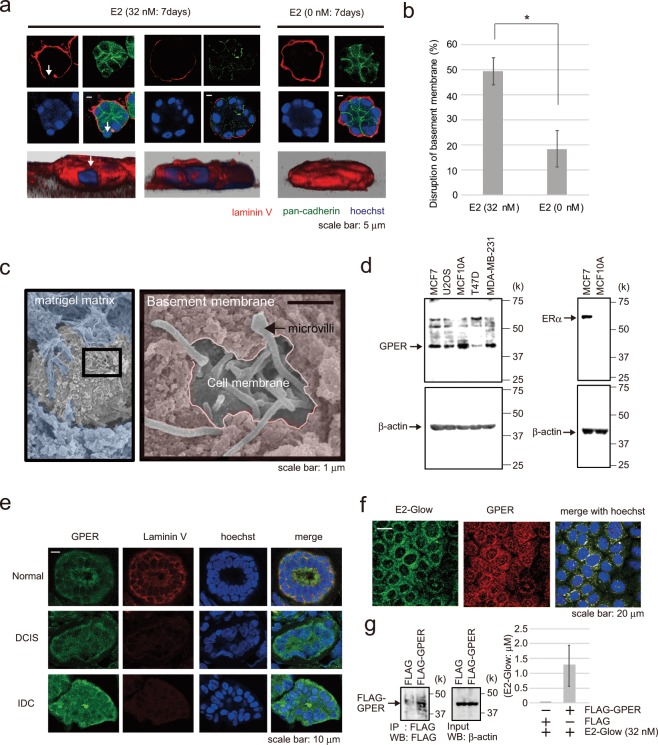
Figure 1.
Effect of E2 on a 3D model of the milk duct using MCF-10A cells. (a) Representative confocal images of MCF-10A cells in a 3D culture through the middle acini, which were treated with E2 (32 nM, left two panels) or control (0 nM, right panel) for 7 days. The basement membrane was examined via immunofluorescence staining using laminin V antibody (red); cell junctions were evaluated using pan-cadherin antibody (green). The reconstructed images of the acini structures by confocal microscopy are shown at the bottom with Hoechst (blue) and laminin V (red) staining. Arrows indicate the collapsed portion of the basement membrane. Scale bars = 5 μm. (b) The basement membrane was stained using anti-laminin V antibody, and the percentage of acini with disrupted basement membranes was calculated. Three independent experiments (32 nM E2; 54.5% (n = 55), 50% (n = 48), 43.8% (n = 57), 0 nM E2; 23.1% (n = 52), 22.2% (n = 54), 10% (n = 50)) were performed. Bars represent +/−SD. DATA were analyzed using a Mann-Whitney U test. *p values less than 0.05 were considered statistically significant. (c) Representative SEM images of MCF-10A cells in a 3D culture treated with 32 nM E2 for 72 h. SEM images are shown in Matrigel matrix (blue) and basement membrane (pink). (d) Western blotting of GPER-expressing cell lysates (MCF-7, U2OS, MCF-10A, T47D, and MDA-MB-231) (left). MCF-7 and MCF-10A cell lysates were further probed for ERα expression. (e) Immunohistochemical analysis of GPER expression (green) and the basement membrane (laminin V, red) in normal human breast, ductal carcinoma in situ, and invasive tissue. Blue, Hoechst staining. Scale bars = 10 μm. (f) Immunofluorescence analysis of MCF-10A cells following treatment with fluorescently labeled E2 (green) for 5 min to examine the colocalization of E2 and GPER (red). Blue, Hoechst staining. Scale bars = 20 μm. (g) Binding of E2-Glow to FLAG-GPER which was expressed in 293 T cells and immunoprecipitated with FLAG antibody. 1.27 ± 0.68 μM E2-Glow was bound to FLAG-GPER. Five independent experiments were performed. Bars represent +/−SD. The presented blots were cropped. Full-length blots are presented in Supplementary Fig. 5.

