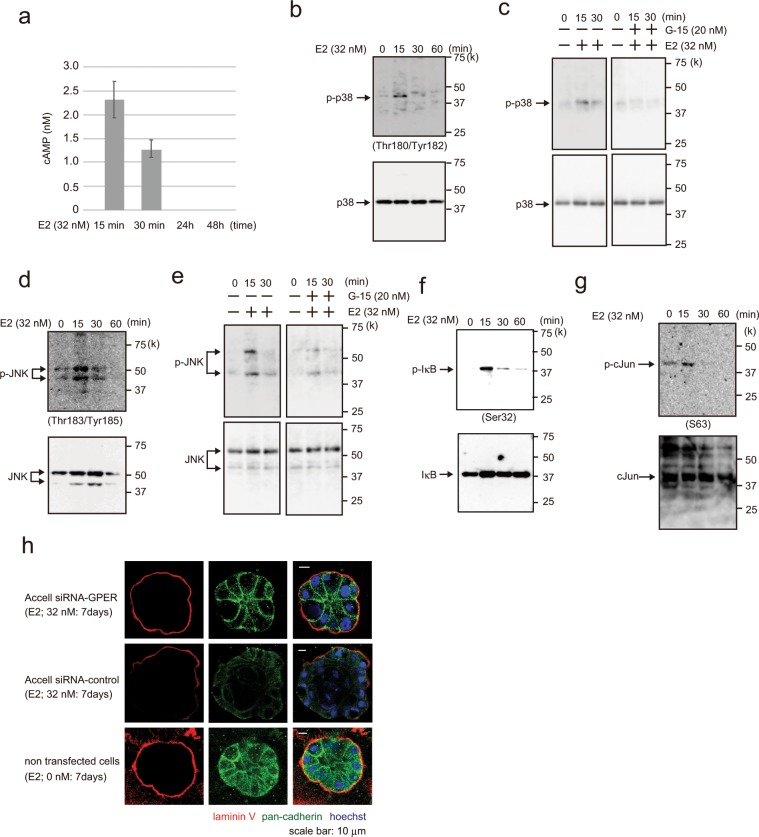
Figure 2.
Analysis of E2 signal transduction. (a) cAMP assay showing cAMP levels (nM) in MCF-10A cells following treatment with 32 nM E2 for 15 min, 30 min, 24 h, and 48 h. Three independent experiments were performed. Bars represent +/−SD. (b) Western blotting of MCF-10A cells showing p38 and phospho-p38 (Thr180/Tyr182) following treatment with 32 nM E2 for 0–60 min. (c) Western blotting of MCF-10A cells treated with 32 nM E2 (left panel) or with 32 nM E2 and 20 nM G-15 (right panel) for 0–30 min. (d) Western blotting of MCF-10A cells showing JNK and phosphor-JNK (Thr183/Tyr185) following treatment with 32 nM E2 for 0–60 min. (e) Western blotting of MCF-10A cells treated with 32 nM E2 (left panel) or with 32 nM E2 and 20 nM G-15 (right panel) for 0–30 min. (f) Western blotting of MCF-10A cells treated with 32 nM E2 for 0–60 min showing IkB and phospho-IkB (Ser32, Ser36). (g) Western blotting of MCF-10A cells treated with 32 nM E2 for 0–60 min showing c-Jun and phospho-c-Jun (Ser63). (h) Representative confocal images of Accell siRNA-GPER- or siRNA-control-transfected MCF-10A cells in a 3D culture through the middle acini, which were treated with E2 (32 nM, left panels) or control (0 nM, right panel) for 7 days. Laminin V (red); pan-cadherin (green). Scale bars = 20 μm. The presented blots were cropped. Full-length blots are presented in Supplementary Fig. 5.

