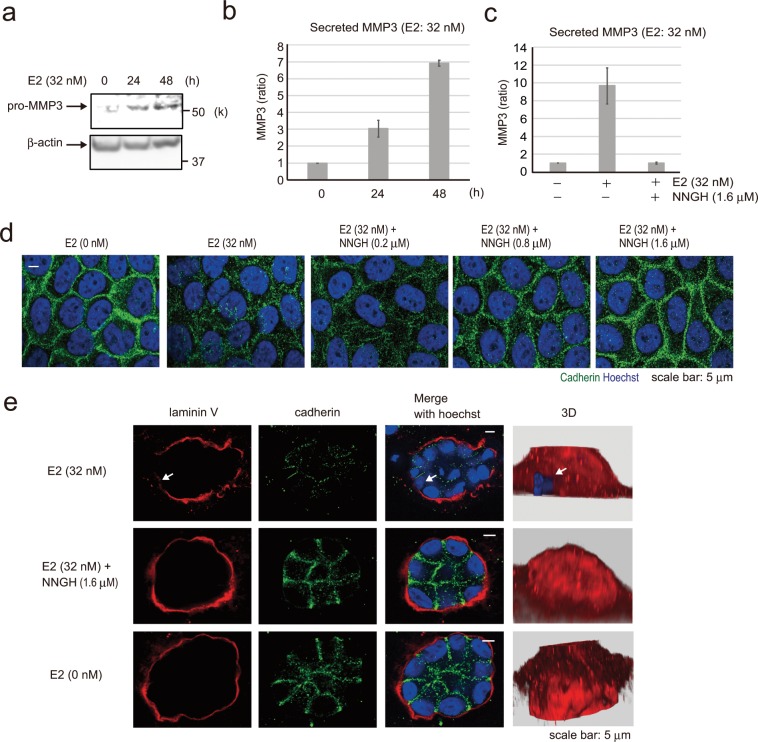
Figure 3.
Effect of E2-induced MMP-3 secretion on cell adhesion and basement membrane. (a) Western blotting of MCF-10A cells showing pro- MMP-3 following treatment with 32 nM E2 for 0, 24, and 48 h. The presented blots were cropped. Full-length blots are presented in Supplementary Fig. 7. (b) MMP-3 activity assay of MCF-10A cells for measuring MMP-3 activity in cell culture media following treatment with 32 nM E2 for 0, 24, and 48 h. Four independent experiments were performed. Bars represent +/−SD. (c) MMP-3 activity assay of MCF-10A cells following treatment with 32 nM E2 with or without 1.6 μM N-isobutyl-N-(4-methoxyphenylsulfonyl)-glycylhydroxamic acid (NNGH), which is a MMP-3 inhibitor. Four independent experiments were performed. Bars represent +/−SD. (d) Representative images of MCF-10A cells treated with 32 nM E2 or 32 nM E2 and NNGH at 200, 800, or 1600 nM for 3 days to detect cell junctions by immunofluorescence using the pan-cadherin antibody (green). Blue staining, Hoechst. Scale bars = 5 μm. (e) Confocal images of MCF-10A cells in a 3D culture treated with 32 nM E2 (first row) or 32 nM E2 and 1600 nM NNGH (second row) for 14 days to investigate the basement membrane via staining with laminin V antibody (red) and cell junctions via the pan-cadherin antibody (green). Reconstruction structures of the acini are shown in the right panel by Hoechst (blue) and laminin V (red). Arrows indicate the collapsed portion of the basement membrane. Scale bars = 5 μm.

