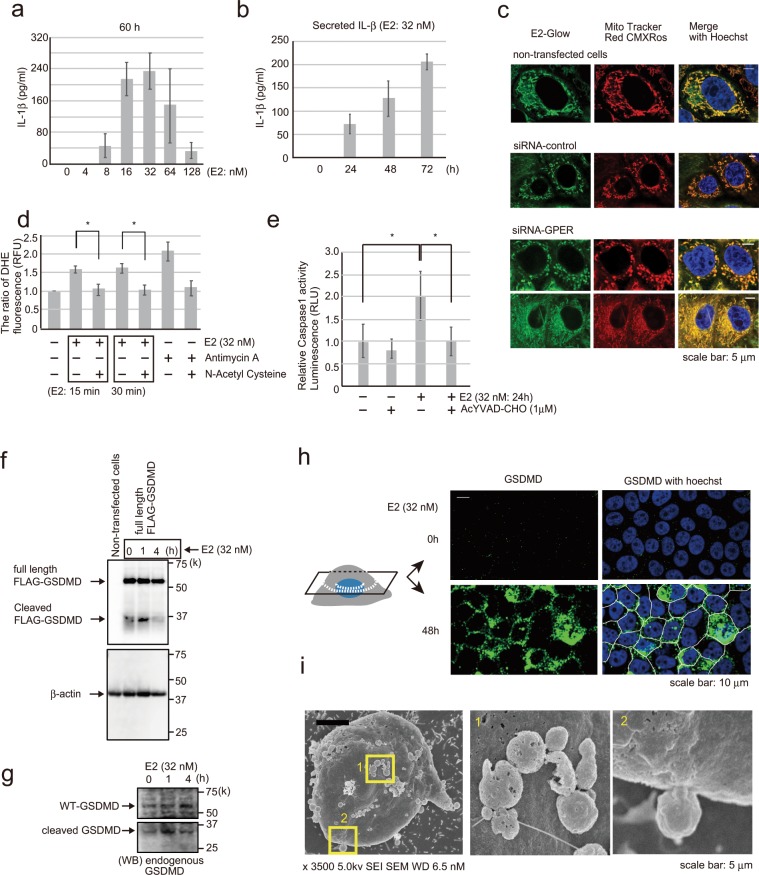
Figure 4.
E2-induced IL-1β secretion and pyroptosis. (a) IL-1β ELISA of MCF-10A cells examined for the concentrations of secreted IL-1β in the cell culture media following treating the cells with 0–128 nM E2 for 60 h. Four independent experiments were performed. Bars represent +/−SD. (b) IL-1β ELISA of MCF-10A cells showing the concentrations of secreted IL-1β in the supernatant following treatment with 32 nM E2 for 1–72 h. Three independent experiments were performed. Bars represent +/−SD. (c) Representative immunofluorescence images of MCF-10A cells following treatment with fluorescently labeled E2 (green) and MitoTracker Red CMXRos (red) to examine the localization of E2 in mitochondria. E2 localized to mitochondria with or without GPER. Blue staining, Hoechst. Scale bars = 5 μm. (d) Cell-based ROS assay to measure ROS in MCF-10A cells following treatment with 32 nM E2 for 15 or 30 min. Antimycin A, an inhibitor of complex 3 of the mitochondrial electron transport chain, was included as a positive control for ROS production, and N-acetyl cysteine was included as an antioxidant control. Four independent experiments were performed. Bars represent +/−SD. DATA were analyzed using a Mann-Whitney U test. *p values less than 0.05 were considered statistically significant. (e) Caspase-1 inflammasome assay was used to measure caspase-1 activity in MCF-10A cells after adding 32 nM E2 for 24 h. YVAD-CHO was used as a caspase-1 inhibitor. Three independent experiments were performed. Bars represent +/−SD. DATA were analyzed using a Mann-Whitney U test. *p values less than 0.05 were considered statistically significant. (f) Western blotting of MCF-10A cells transfected with p3xFLAG-GSDMD to investigate full-length FLAG-GSDMD and cleaved FLAG-GSDMD (31 kDa) using the FLAG antibody following treatment with 32 nM E2 for 0–4 h. (g) Western blotting of MCF-10A cells showing endogenous WT-GSDMD (full length) and cleaved GSDMD following treatment with 32 nM E2 for 0–4 h using an antibody that recognizes the GSDMD-N-terminal. (h) Confocal images of MCF-10A cells treated with 32 nM E2 for 48 h (bottom) or without 32 nM E2 (up) and stained with the GSDMD antibody (green) to investigate GSDMD (N-terminal) distribution on the plasma membrane. Two confocal cellular cross sections are shown. Scale bars = 10 μm. (i) SEM electron microscopy imaging of MCF-10A cells treated with 32 nM E2 for 72 h showing pyroptotic bodies on the surface of the plasma membrane. Scale bars = 1 μm. The presented blots were cropped. Full-length blots are presented in Supplementary Fig. 7.

