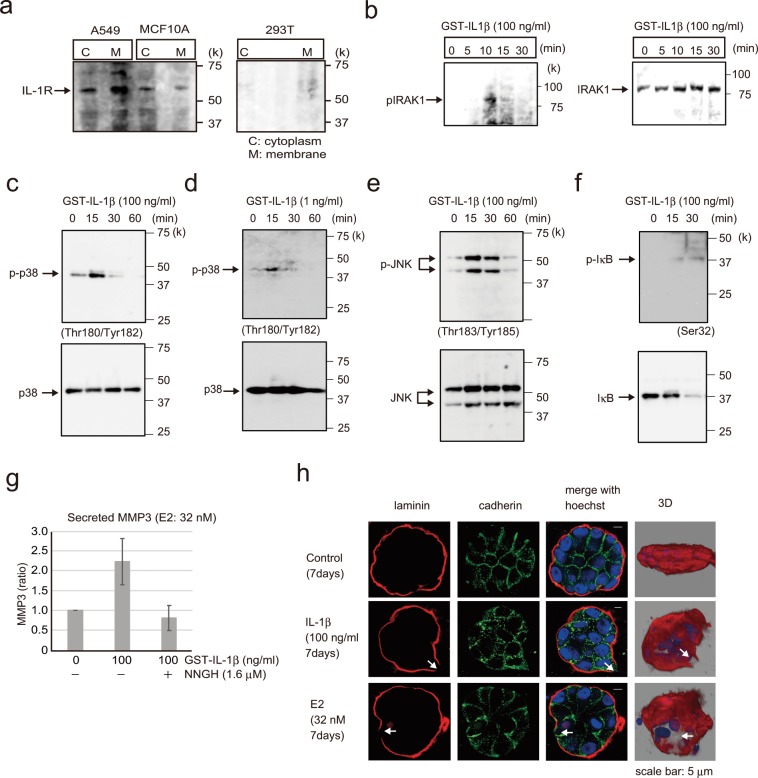
Figure 5.
Analysis of E2 signal transduction. (a) Western blotting of A549, MCF-10A, and 293T cell lysates showing IL-1R expression; cytoplasmic and membrane components of the cell lysates were separated. A549 cells were included as a positive control for IL-1R1 expression, and 293T cells were used as a negative control. (b) Western blotting of MCF-10A cells showing phospho-IRAK1 (left) and IRAK1 (right) following treatment with 100 ng/ml GST-IL-1β for 0–30 min. (c) Western blotting of MCF-10A cells probed to examine phospho-p38(Thr180/Tyr182) and p38 after adding 100 ng/ml GST-IL-1β for 0–60 min. (d) Western blotting of MCF-10A cells probed to examine phospho-p38 (Thr180/Tyr182) and p38 after adding 1 ng/ml GST-IL-1β for 0–60 min. (e) Western blotting of MCF-10A cells showing phospho-JNK(Thr183/Tyr185) and JNK following treatment with 100 ng/ml GST-IL-1β for 0–60 min. (f) Western blotting of MCF-10A cells showing phospho-IkB (Ser32) and IkB following treatment with 100 ng/ml GST-IL-1β for 0–30 min. (g) MMP-3 activity assay of MCF-10A cells following treatment with 100 ng/ml GST-IL-1β with or without 1.6 μM NNGH, which was used as an MMP-3 inhibitor. Four independent experiments were performed. Bars represent +/−SD. (h) Representative confocal images of MCF-10A cells in a 3D culture treated with 100 ng/ml GST-IL-1β (second row) or E2 (32 nM, third row) or control (first row) for 7 days to examine the basement membrane via immunofluorescence staining with laminin V antibody (red) and cell junctions with the pan-cadherin antibody (green). Reconstruction images of the acini structures via confocal microscopy are shown in the right panel with Hoechst (blue) and laminin V (red). Arrows indicate the collapsed portion of the basement membrane. Scale bars = 5 μm. The presented blots were cropped. Full-length blots are presented in Supplementary Fig. 7.

