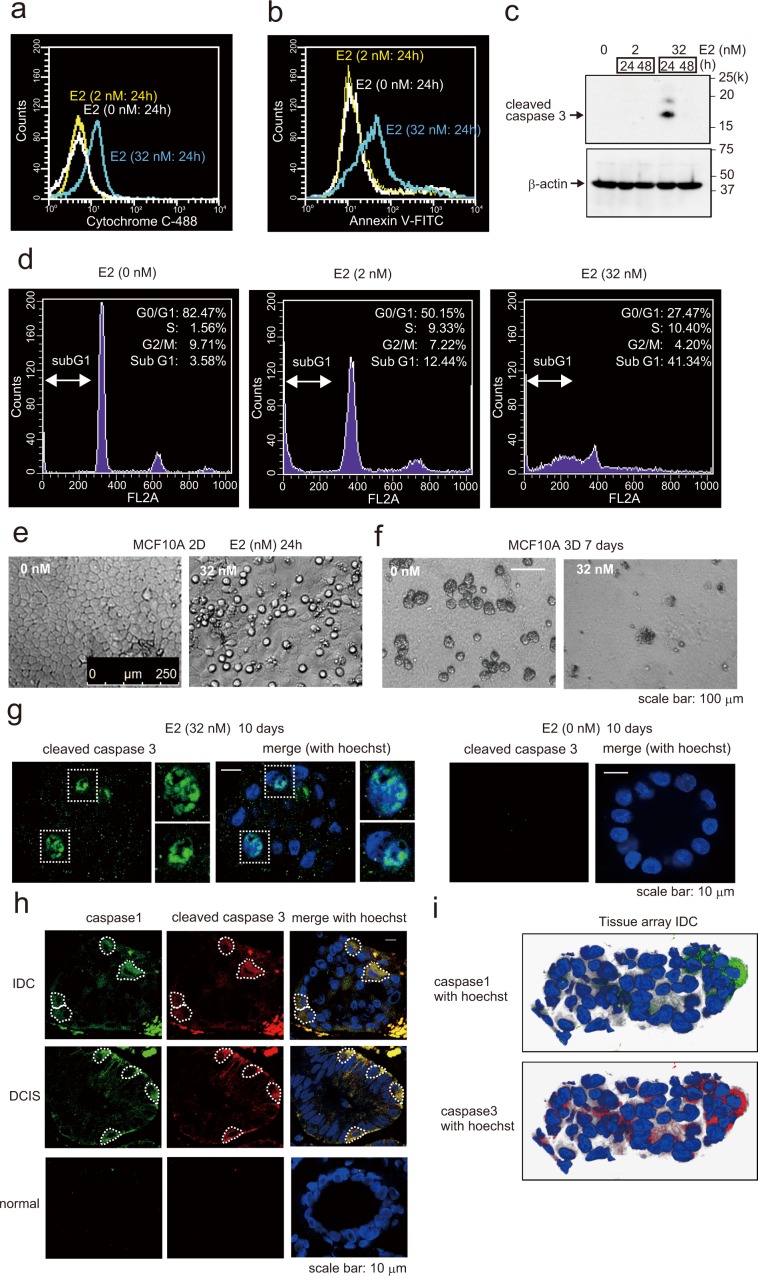
Figure 6.
Detection of apoptosis and pyroptosis following E2 exposure. (a) Flow cytometry of MCF-10A cells treated with or without E2 (2 nM or 32 nM) for 24 h to examine cytochrome c expression compared with the control group. (b) Flow cytometry of MCF-10A cells treated with or without E2 (2 nM or 32 nM) for 24 h and stained with annexin V/PI and examined for the proportion of cells simultaneously positive for both PI and annexin V compared with the control group. (c) Western blotting of MCF-10A cell lysates probed to detect cleaved caspase-3 following treatment with 2 or 32 nM E2 for 24 or 48 h. (d) Flow cytometry of MCF-10A cells treated with or without E2 (2 or 32 nM) for 24 h to investigate cell cycle changes. (e) Phase-contrast morphology of MCF-10A cells grown as a monolayer and treated with or without 32 nM E2 for 24 h. (f) Phase-contrast micrographs of MCF-10A acini basement membranes cultured for 2 weeks and then treated with 32 nM E2 for 7 days (right). Normal MCF-10A acini (left) possess a spherical architecture similar to that observed in vivo. (g) Representative confocal images of MCF-10A acini treated with 32 nM E2 (left) or control (right). Green, cleaved caspase staining; blue, Hoechst staining. Scale bars = 10 μm. (h) Confocal images of human breast IDC (first row), DCIS (second row), and normal (third row) tissues immunohistochemically stained with caspase-1 antibody (green) and cleaved caspase-3 antibody (red). Caspase-1 and cleaved caspase-3 were closely merged in IDC and DCIS tissues. Blue, Hoechst staining. Scale bars = 10 μm. (i) Reconstruction images of IDC breast tissues via confocal microscopy are shown. Caspase-1 staining (green) merged with Hoechst (left) and cleaved caspase-3 staining (red) merged with Hoechst (right). The presented blots were cropped. Full-length blots are presented in Supplementary Fig. 8.

