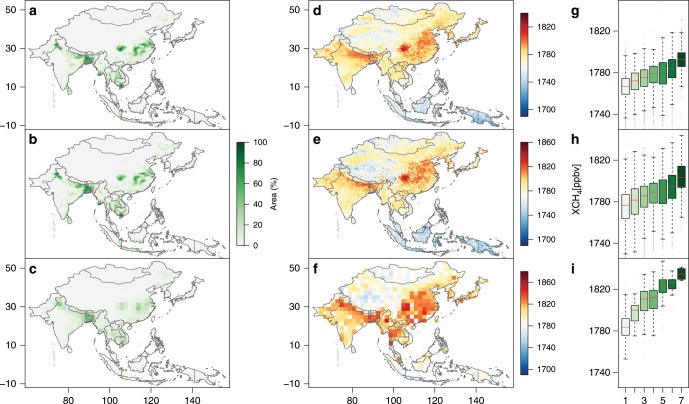
Fig. 2. Consistency of spatial distributions between paddy rice croplands and atmospheric methane concentration.
The three periods (2003–2005, 2007–2009, and 2011–2013) were selected in the main text to illustrate the spatial relationships between rice paddies and XCH4. a–c Spatial distributions of 3-year averaged area proportions of MODIS-based paddy rice croplands for 2003–2005 with 0.5° gridcells (a), 2007–2009 with 0.5° gridcells (b), and 2011–2013 with 2.0° gridcells (c). d–f Spatial distributions of 3-year averaged annual column-averaged concentration of CH4 (XCH4) from SCIAMACHY for 2003–2005 with 0.5° resolution (d), 2007–2009 with 0.5° resolution (e), and from TANSO-FTS for 2011–2013 with 2.0° resolution (f). g–i 3-year averaged annual XCH4 for different rice paddy area proportions for 2003–2005 (g), 2007–2009 (h), and 2011–2013 (i). The x-axis values in figures (g–i) represent levels of rice paddy area proportions in monsoon Asia, and 1–7 correspond to <0.5%, 0.5–1%, 1–5%, 5–10%, 10–20%, 20–40%, and >40% rice paddy area proportions, respectively. Source data are provided as a Source Data file.

