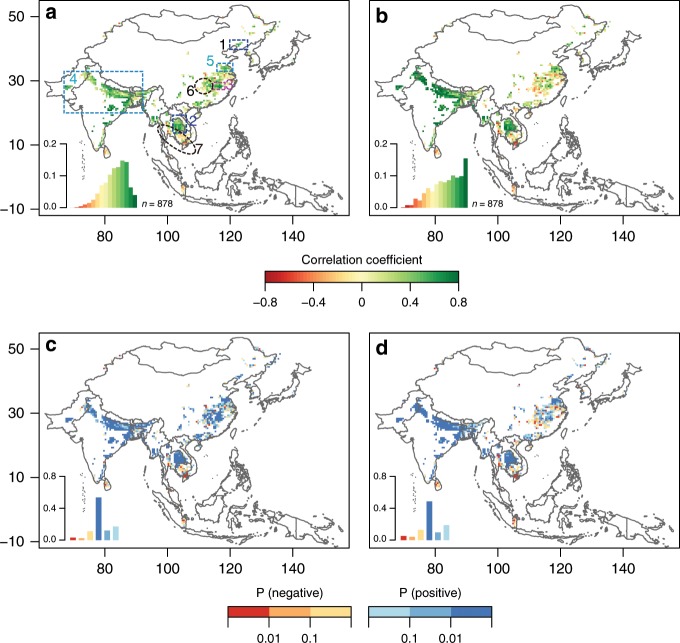
Fig. 4. Spatial patterns of correlations between seasonal atmospheric methane concentration and rice growth.
The monthly atmospheric column-averaged methane concentration (XCH4) from SCIAMACHY and the enhanced vegetation index (EVI) from MODIS were analyzed in the dense rice paddy areas of monsoon Asia during 2003–2005. a, b The spatial distributions of Pearson’s correlation coefficients between XCH4 and EVI for the whole year and summer-fall season from May to November, respectively. c, d The spatial distributions of significance levels of Pearson’s correlation between the two for the whole year and summer-fall season from May to November, respectively. The region with a 3-year averaged rice paddy gridcells with area proportion larger than 10% during 2003–2005 is considered here. The insets in (a–d) are the corresponding frequency diagrams of Figure (a–d). Source data are provided as a Source Data file.

