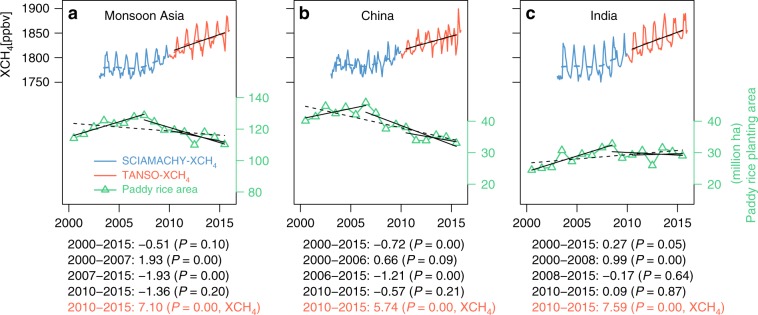
Fig. 5. Temporal dynamics of atmospheric methane concentration and rice paddy area.
Temporal (seasonal and interannual) dynamics of atmospheric column-averaged methane concentration (XCH4) over rice paddy-dominated regions and interannual variations in MODIS-based rice paddy areas during 2000–2015 in monsoon Asia (a), China (b), and India (c). The curves above are time series of monthly SCIAMACHY CH4 column volume mixing ratios (VMRs, in parts per billion) during 2003–2009 and monthly TANSO-FTS CH4 column VMRs during 2010–2015. The XCH4 outliers in winter have been removed. The blue and red dashed lines are average annual values of SCIAMACHY XCH4 and TANSO-FTS XCH4, respectively. The black lines and black dashed lines below indicate trends of rice paddy area for different periods in monsoon Asia, China, and India. The rice paddy-dominated regions are shown in Supplementary Fig. 35. The linear trends and its significance levels for different periods are shown below the panels; the formulas in black color are for paddy rice planting area, and the formula in red is for XCH4. Source data are provided as a Source Data file.

