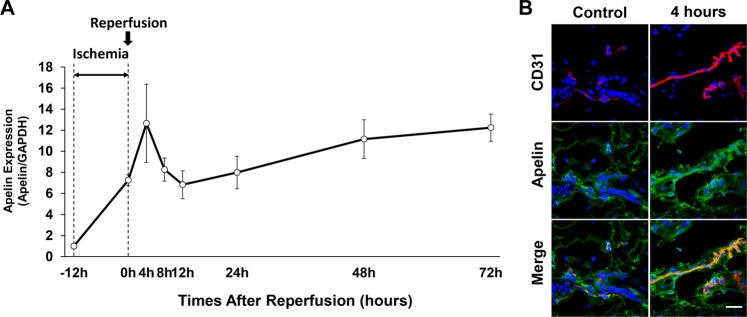
Figure 1.
Apelin expression and distribution during ischemia-reperfusion (I/R) injury. (A) Quantification of apelin mRNA levels in the I/R site from the beginning of ischemia to 72 hours after reperfusion by quantitative reverse transcriptase–PCR (RT–PCR). The end of ischemia was assigned 0 hour. Data are relative to mRNA level in -12 hours. Values were determined in n = 4. (B) Expression and distribution of apelin in the skin before ischemia (control) and at 4 hours after reperfusion (red: CD31, green: apelin). Scale bar = 20 μm. All values represent mean ± SEM. **P < 0.01, *P < 0.05.

