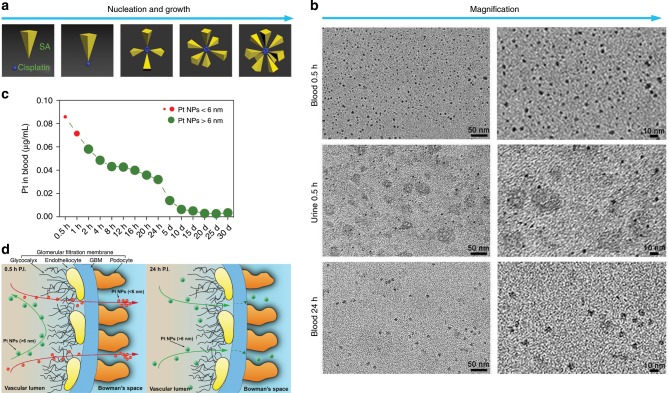
Fig. 2. Biosynthesis and metabolism of Pt NPs after cisplatin chemotherapy.
a Illustration of the process of nucleation and growth of Pt NPs. b The varying sizes of Pt NPs in patient blood at 0.5 h after cisplatin treatment (top), in the urine 0.5 h after treatment (middle) and in the blood 24 h after treatment (bottom). The right panels show a higher magnification. c The concentration of Pt NPs in patient blood after cisplatin chemotherapy over a 30 d period after treatment. d Illustration of the glomerular filtration of different sized Pt NPs; Pt NPs <6 nm more easily traverse the GBM than Pt NPs >6 nm.

