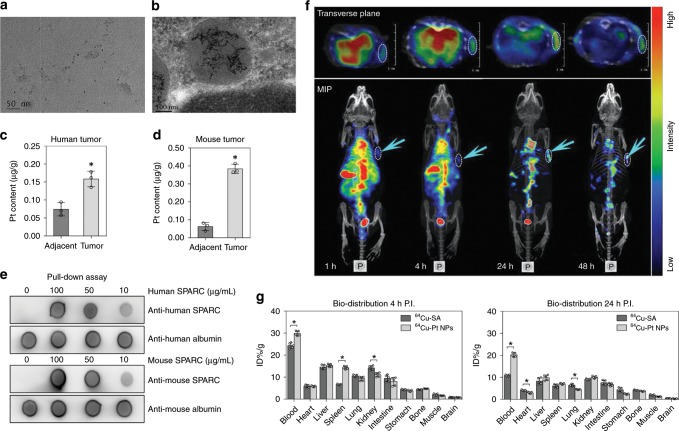
Fig. 4. Tumor targeting and bio-distribution of Pt NPs in vivo.
a Representative TEM image of Pt NPs in a human tumor homogenate. b 120 kV bio-TEM showing accumulated Pt NPs in a tumor cell from resected patient tumor tissue. c Quantification of the Pt NPs in a human tumor and adjacent, normal tissue (n = 3). *P < 0.05. d Quantification of the Pt NPs in a mouse tumor and normal, adjacent tissue (n = 3). *P < 0.05. e Pull-down assay to evaluate the interaction of Pt NPs with SPARC. For human-derived Pt NPs, the Pt NPs were incubated with human SPARC proteins at different concentrations, followed by ultra-centrifugal separation. The SPARC-Pt NP complexes were then subjected to dot blot analysis using an anti-human SPARC antibody. An anti-human albumin antibody was applied as the loading control. For mouse-derived Pt NPs, the same experiment was performed, using a mouse-specific SPARC protein and antibody. f NanoScan SPECT/CT imaging of 125I-Pt NPs in DNR-resistant K562 cell-xenografted nude mice (n = 5) at 1, 4, 24 and 48 h after intravenous injection of the NPs. The arrows and dotted circles indicate the tumors. MIP: Maximum Intensity Projection. g Time-dependent bio-distribution of 64Cu-SA and 64Cu-Pt NPs in C57BL/6 mice. The results are presented as the percentage injected dose g−1 of tissue (% ID g−1). The bars in the histogram represent the results from five independent experiments. *P < 0.05. Data = Mean±Standard deviation.

