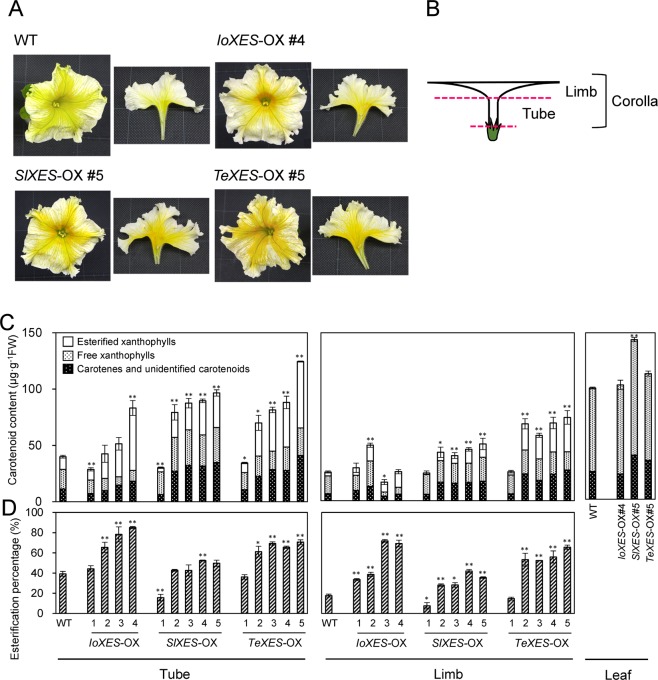
Figure 1.
Phenotypes of XES-OX plants. (A) Flowers of XES-OX and WT plants on flowering day. (B) Sampling positions. (C) Total carotenoid content. Data obtained from leaves of IoXES-OX #4, SlXES-OX #5, and IoXES-OX #5 were shown as representatives of each line. (D) Percentage of esterified xanthophylls to total xanthophylls in corolla tubes, corolla limbs, and leaves of XES-OX and WT plants. Analyses were performed in triplicate. Means ± SE are shown. *P < 0.05, **P < 0.01 versus WT (Student’s t-test).

