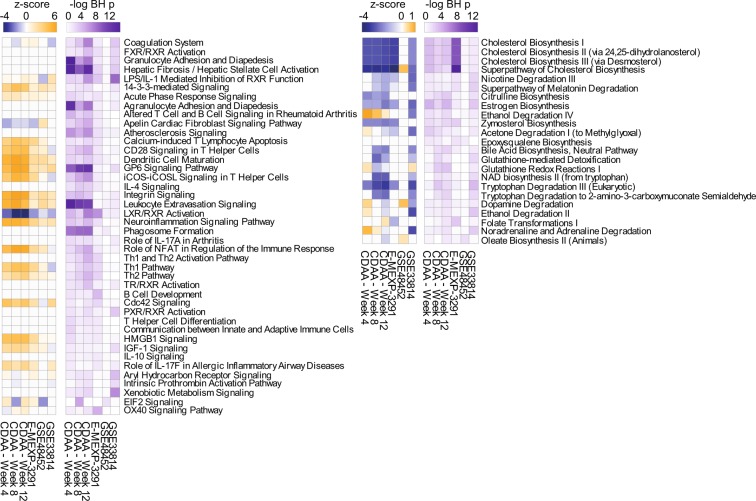
Figure 3.
Comparison of rat CDAA to human NASH mRNA datasets on pathway level. Analysis match of overrepresentation analyses of canonical pathways using IPA of all rat data and three selected human datasets. Data are filtered to give at least one hit in a human study and one rat CDAA time point with Benjamini-Hochberg adj. p value < 0.05. Left panel: Signaling pathways, right panel: metabolic pathways (see Supplementary Table S2 for details). Note: Due to different reference datasets, the p values of the analyses are not directly comparable.

