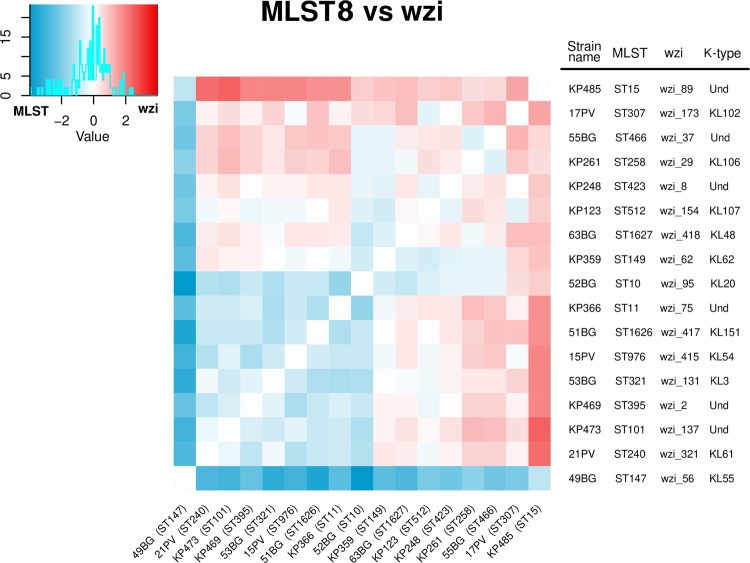
Figure 3.
Arithmetic difference between the average melting temperature distance matrices computed among the 17 Klebsiella pneumoniae strains (selected to belong to 17 different STs) using the MLST8 scheme (eight primer pairs on seven genes) and wzi scheme (two primer pairon one gene). The heatmap colours range from blue to white to red: if the temperature distance between two strains is greater for the MLST8 than the wzi scheme the relative position on the heatmap is coloured in blue, otherwise in red.

