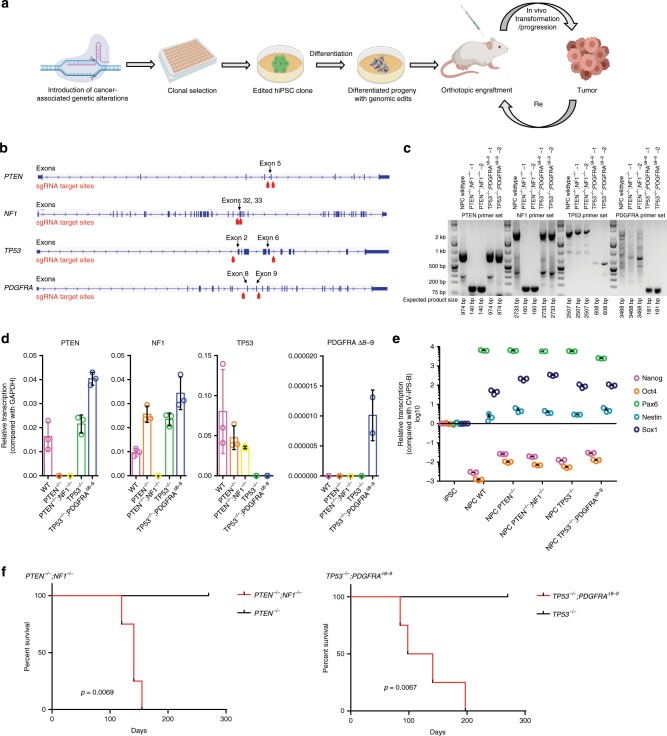
Fig. 1. Different iHGG models derived from edited human iPSCs.
a Schema of iHGG generation. b Designs for gene editing indicating placement of sgRNAs. c Genotyping PCR and d Semi-quantitative RT-qPCR evaluating designated edits. Data are representative of three replicates, n = 3. Data are represented as mean ± SD. e RT-qPCR results of markers for iPSCs and NPCs. Data are representative of three replicates, n = 3. Data are represented as mean ± SD. f Kaplan–Meier curves showing survival of mice engrafted with (left) PTEN−/− NPCs, PTEN−/−;NF1−/− NPCs, (right) TP53−/− NPCs, and TP53−/−;PDGFRAΔ8–9 NPCs. Statistical significance was evaluated by the log-rank test. n = 4 animals for each arm for each model. Source data are provided as a Source Data file.

