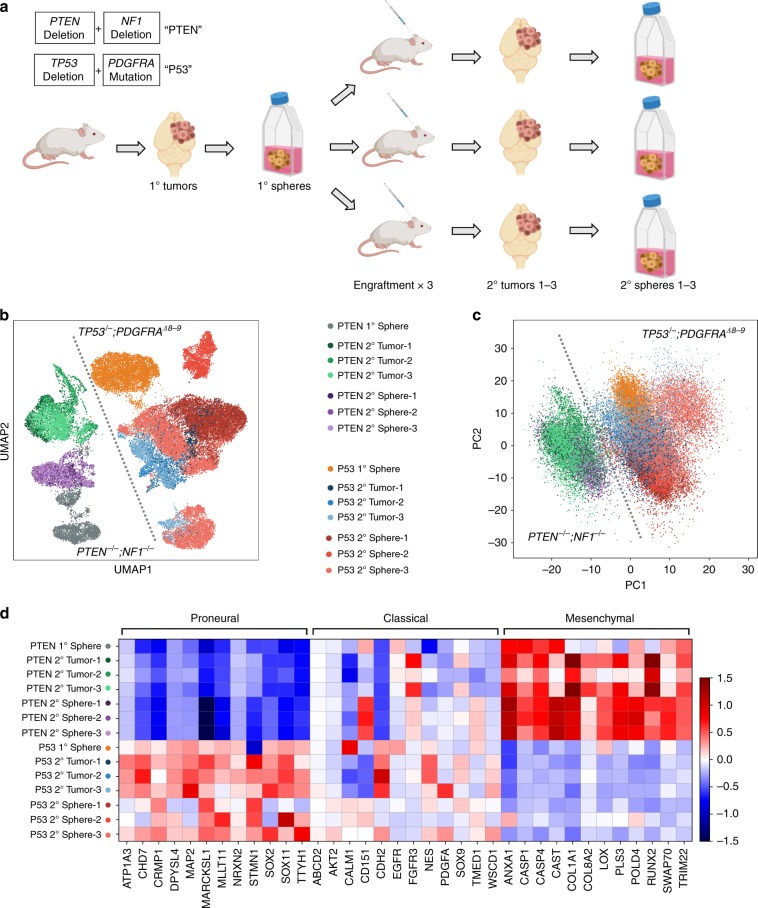
Fig. 4. iHGG models present inter-tumor heterogeneities and divergent transcriptomes driven by molecular subtypes.
a Schema of scRNA-seq analysis of iGBMs. b Uniform Manifold Approximation and Projection (UMAP) analysis of all sequenced samples. c Principal component analysis of all sequenced samples (the color code is same as in b). d The heatmap of GBM molecular subtype analysis based on average gene expression of individual cells in each sample for a manually curated gene list based on ref. 18.

