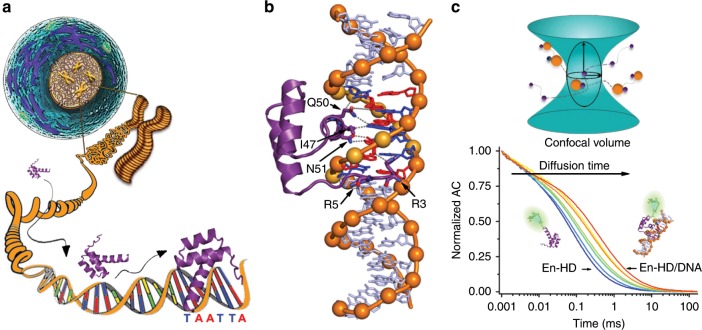
Fig. 1. EngHD binding to the target specific site.
a Pictorial representation of the challenges involved in tracking the target cognate site in the genomic DNA of a eukaryotic cell. b 3D Structure of the specific complex between EngHD and DNA (PDB: 1HDD). c Schematic diagram of how to determine binding of EngHD to DNA using FCS. (top) The miniscule illumination volume of a confocal microscope is used to monitor fluctuations in the emission of fluorescent-labeled EngHD molecules (purple) while in diffusive transit. When bound to the much larger DNA molecule (orange), EngHD experiences delayed diffusion, staying longer within the illumination volume. The fluorescence autocorrelation decay (bottom) represents the average diffusion, which depends on the fraction of free and bound EngHD molecules. FCS experiments at various concentrations of DNA permit to accurately determine the dissociation constant from the combined autocorrelation decays.

