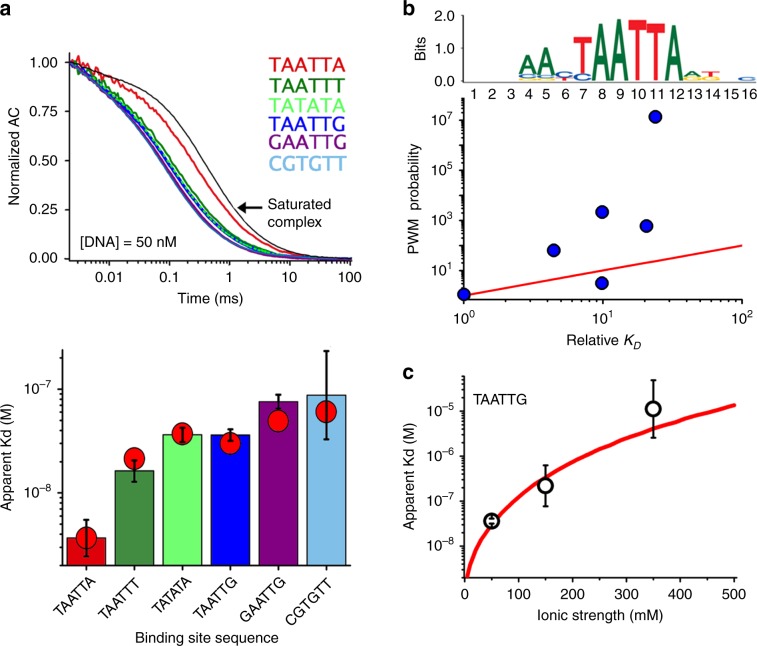
Fig. 2. Mapping the energetics of EngHD binding to DNA.
a (top) Experimental FCS autocorrelation decays of EngHD in the presence of 50 nM of each of the six 75-bp DNA molecules based on the β3 tubulin gene with variations in the SB site. The average diffusion time relative to diffusion of the saturated complex (black curve) reflects the fraction of bound molecules. (bottom) Dissociation constants for the six 75-bp DNAs determined experimentally by FCS from three independent experiments and calculated by the statistical mechanical model (red circles). b Experimental changes in binding affinity compared with the changes expected by pure consensus binding. The upper panel shows the consensus binding logo for engrailed obtained from bacterial one-hybrid high throughput assays. The lower panel shows the correlation between the experimental changes in binding affinity, KD(variant) · KD(specific)−1, in the abscissa; and the inversed relative probability of binding calculated from the position weight matrix, pPWM (specific) · pPWM(variant)−1, in the ordinate. c Ionic strength dependence of EngHD binding to the 75-bp DNA molecule bearing the natural TAATTG high affinity site (dark blue in a). Experimental data are shown as black open circles and the statistical mechanical model calculation is shown as a red curve. Bars delimit the 95% confidence interval, see Supplementary Table 2. Source data are provided as a Source Data file.

