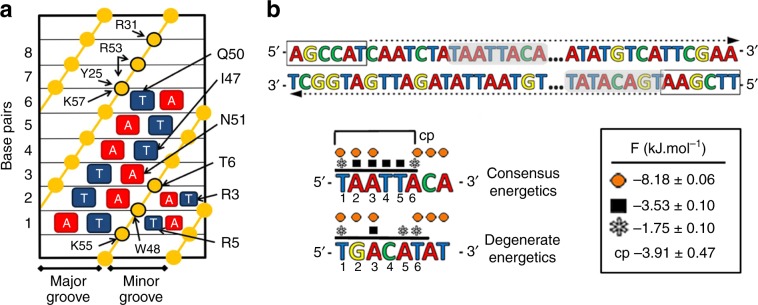
Fig. 3. Statistical mechanical model to describe the DNA-binding modes of EngHD.
a Scheme of the various interactions existing between EngHD and DNA as observed in the 3D structure of the EngHD-DNA complex (based on ref. 40, PDB: 1HDD). b (top) Representation of how the statistical mechanical model calculates all possible binding events using a 6-bp sliding window that runs 5′–3′ through both strands. (bottom) detailed binding energetics for the two exemplary binding sites selected from the top (shown on top as gray boxes). The upper example includes all the specific binding interactions of a full consensus site, and the lower is an example of a degenerate consensus site. The model and interactions are described in the text, and the parameters obtained after global optimization against all experimental data (Figs. 2, 4 and 5) together with their statistical significance (one standard deviation) are given in the box. Black symbols correspond to consensus core tetrad interactions (), gray asterisks correspond to degenerate consensus interactions with A or T (). Orange circles correspond to electrostatic (nonspecific) interactions, which extend over 8-bp () and cp is the cooperative interaction that takes place when the site includes the full consensus sequence (; see model description).

