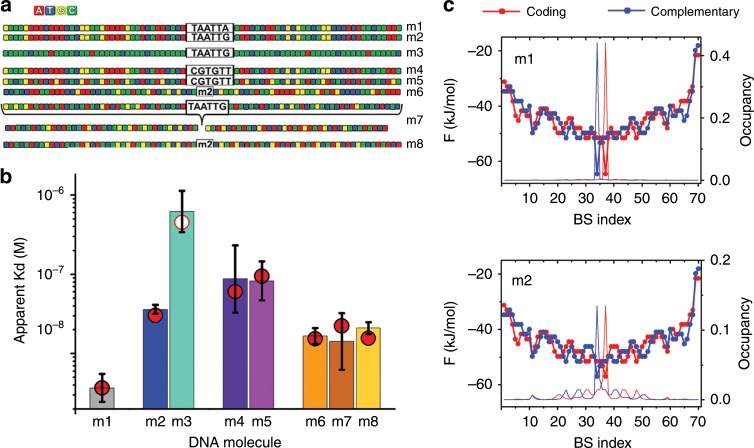
Fig. 4. The region around the specific site produces a rugged free energy landscape.
a DNA molecules used to explore the effects of the sequence of the region flanking the specific site. b Dissociation constants for the DNA molecules shown in panel a obtained by FCS from three independent experiments, and calculated by the statistical mechanical model (red circles). c Examples of binding free energy landscapes and EngHD occupancy profiles obtained by the model. BS index indicates the position of the first base of each potential binding site in the coding or complementary strands. The free energy scale is given on the left, and the probability of each site being occupied on the right y-axis. The occupancy profiles have been calculated at the same DNA concentration of 10 nM: just above the KD for m1 and below the KD for m2. Bars delimit the 95% confidence interval, see Supplementary Table 2. Source data are provided as a Source Data file.

