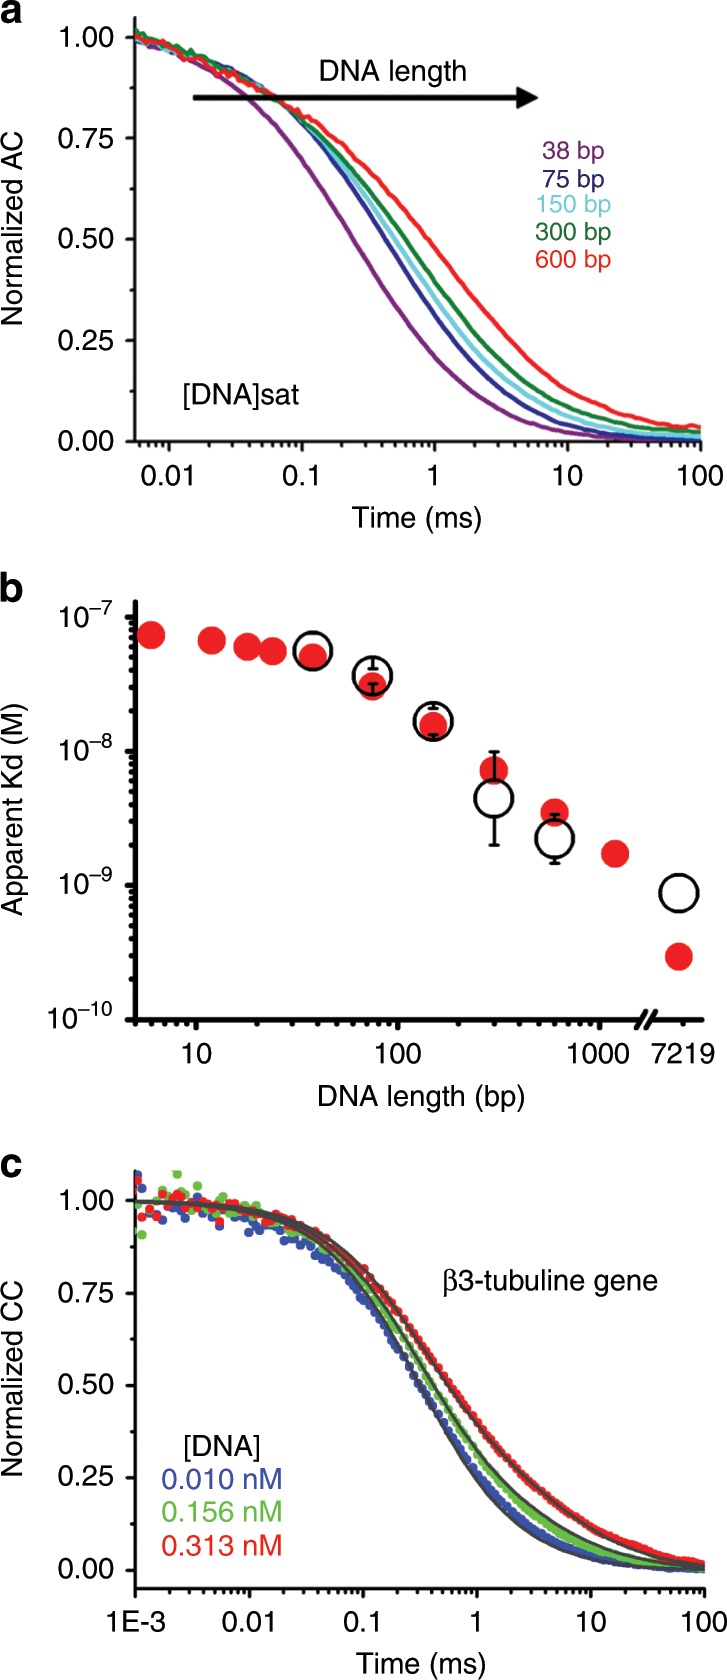
Fig. 5. Amplification of EngHD binding affinity induced by the flanking region.

a FCS autocorrelation decays of EngHD measured in the presence of saturating concentrations of DNA molecules of different size. b Dissociation constants of EngHD binding to DNA molecules of varying size determined experimentally by FCS from three independent experiments on the 5 DNAs of panel a (open black circles), and predicted by the model (red circles). The data at 7219 bp corresponds to the affinity of the β3-tubulin gene (panel c) with experiment and model prediction as before. c FCS cross-correlation decays of EngHD measured in the presence of various concentrations of a DNA molecule encompassing the entire β3-tubulin gene sequence (see Fig. 6b). Bars delimit the 95% confidence interval. Source data are provided as a Source Data file.
