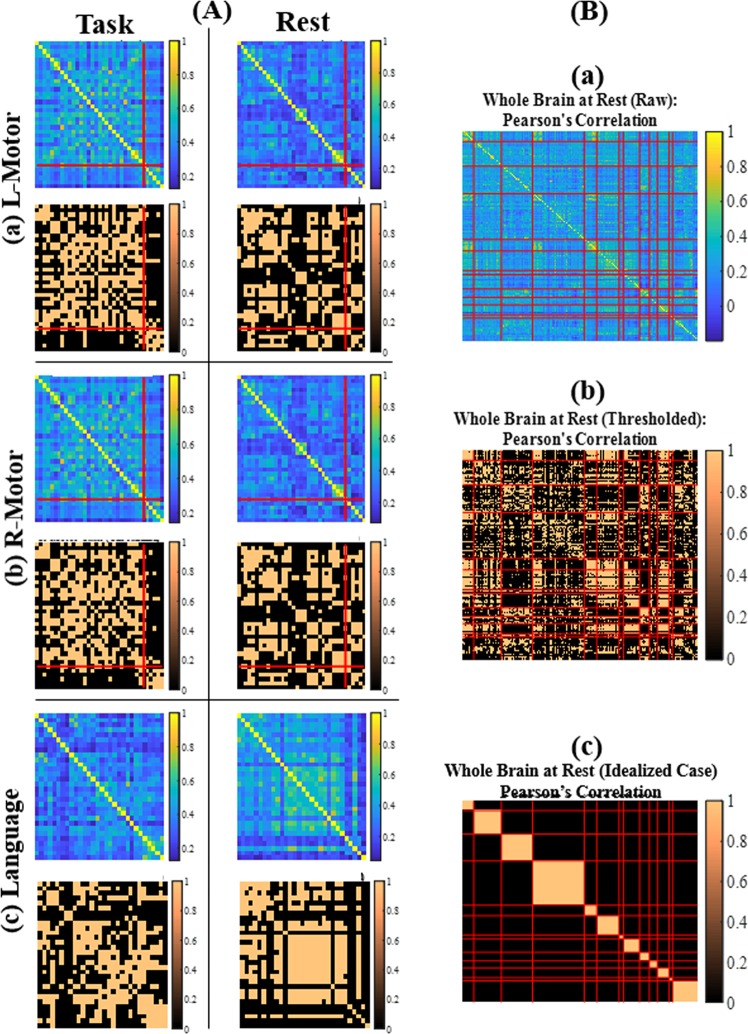
Figure 2.
FC in 19 young healthy adults. (A) Comparison of FC based on Pearson’s correlation in between task and resting-state conditions for E1 in: (a) left motor (b) right motor and (c) language networks. (B) Whole brain resting-state FC defined based on Pearson’s correlation in 13 distinct brain networks given by Power functional atlas in E1. Note: (A) defined based on Power functional atlas. In each sub-image, the first row represents the FC matrix averaged across all 19 participants (i.e. each cell was the average of individual FC values in the cell) and the second row represents the thresholded FC matrix averaged across all participants. The red lines in (a) and (b) show the separation between hand-motor and mouth-motor brain regions. Similar matrices for the alternative measures of FC can be found in Supplementary Fig. 2. (B) (a) FC matrix averaged across all 19 participants (i.e. each cell was the average of individual FC values in the cell); (b) thresholded FC matrix averaged across all participants; (c) simulated idealized FC matrix. The red lines represent the separation between brain regions belonging to a specific network. The regions are grouped in the following order: audio, visual, motor, default mode, cingulo-opercular task, fronto-parietal task, memory, salience, dorsal attention, ventral attention, subcortical, cerebellar, uncertain networks. Similar matrices for the alternative measures of FC can be found in Supplementary Fig. 3.

