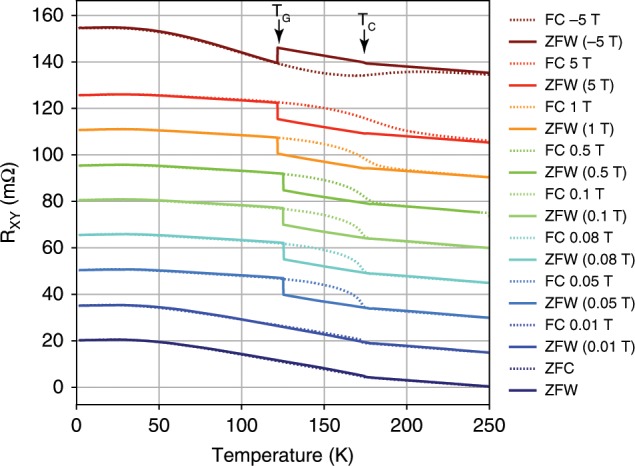
Fig. 3. A transition at 125 K.

Rxy as function of temperature for zero-field warming (ZFW) up after in-field cooling (FC) of the sample. For each cooling in-field (dotted lines) the zero-field warming up (solid) is of the same color. On the zero-field warming up curves, the transition at 125 K is evident as a jump to a different value. For cooling in positive (negative) field, the jump at 125 K is to a lower (higher) value. The curves for different fields are shifted vertically for clarity and an easier comparison.
