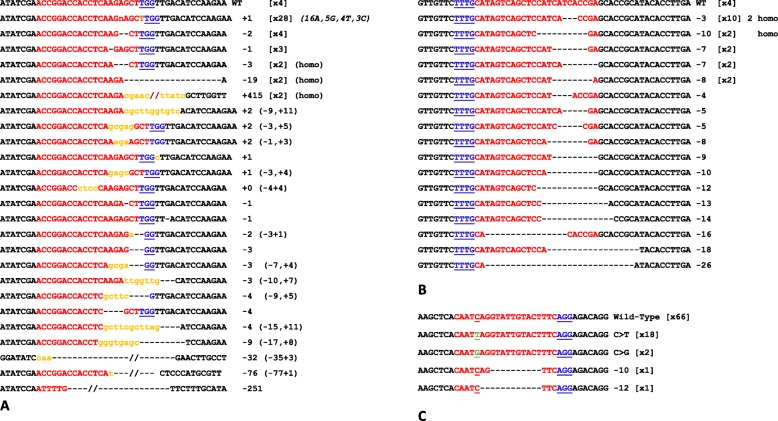
Fig. 3.
Mutations and associated frequencies generated by SpCAS9 A), LbCPF1 B) and BECAS9 C). PAMs are shown in blue, spacers in red, genomic sequences in black, inserted nucleotides in orange, and substituted nucleotides in green; − corresponds to a nucleotide deletion. For example, (− 15,+ 11) indicates a mutation due to a deletion of 15 nucleotides and an insertion of 11 nucleotides. (× 4) indicates the number of times this allele is found

