Figure 2.
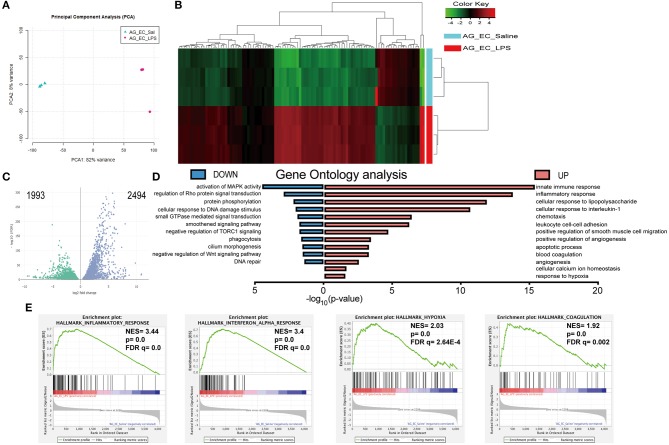
Bioinformatics analysis of the transcriptomes of the adrenal microvascular endothelial cells isolated from saline- and LPS-treated mice. Logarithm transformed counts from RNA-Seq dataset of adrenal microvascular endothelial cells isolated from saline- and LPS-treated adrenal glands were computed for sample correlation or variance by PCA analysis. Percentages in the PCA analysis axis indicated the proportional variance explained by each PC. LPS samples were labeled in red and Saline samples were labeled in blue that represented as condition located in the upper left part of the plot (A). Unsupervised hierarchical clustering of the most 100 up- and down-regulated genes were computed by Euclidean distance clustering and expression heatmap with normalized raw z-scores. The labeling of Condition and DE were adapted as previous panels. (B) A volcano plot was depicted with –log10(FDR) against log2FoldChange of all 4487 significantly altered genes that were detected from the RNA-Seq dataset. Differential expression (DE) of genes was colored with green and blue, regarding 1,993 down-regulated and 2,494 up-regulated genes, respectively. Significance of differential gene expression was determined with adjusted p-value (p adj.) < 0.05 and counts > 50 (C). Pyramid plot with bidirectional –log10 (p-value) demonstrated the involved gene ontology (GO) terms and pathways from submitted UP- or DOWN-regulated gene lists. The EASE score of p-value < 0.05 was set by DAVID software. Identical color code was used for showing UP and DOWN groups. N = 3 for each condition (D). Representative 4 significantly enriched gene sets from GSEA analysis of 4,487 significantly changed genes in the RNA-Seq dataset. Enrichment plots comparing LPS toward Saline were depicted with the following sets of genes: (A) Hallmark Inflammatory response. (B) Hallmark Interferon-alpha response, Hallmark Hypoxia and Hallmark Coagulation (E). Comparison of samples, NES, nominal p-value, and FDR q-value were determined by the GSEA software and were indicated within each enrichment plot.

