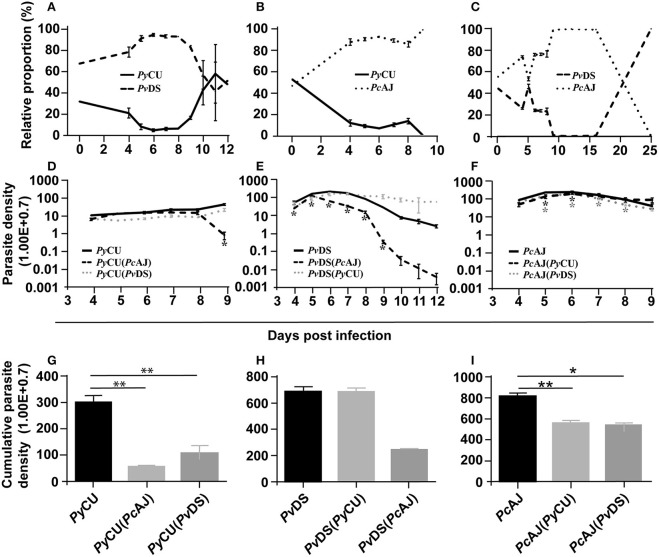
Figure 3.
The relative proportions of Plasmodium yoelii CU, Plasmodium vinckei DS, and Plasmodium chabaudi AJ in mixed infections (A–C), the parasite density of each species in single and mixed infections (D–F), and cumulative parasite density of each species in either single or mixed infections (G–I). The relative proportion of each species in combination with each other (A–C) was measured by qPCR quantification using primers specific to a region of the msp1 gene of each species. Copy numbers of parasite msp1 were quantified with reference to a standard curve generated from known numbers of plasmids containing the same gene sequences. The average copy numbers per iRBC were generated by copy numbers and parasite densities of each single species infections on day 6 PI. Data points indicate the mean value for 3–5 mice in each experimental group and error bars indicate the SEM. The parasite densities (number of blood stage parasites per mL blood) are shown in (D–F). (D) Shows the parasite densities of PyCU single infection or in mixed infection with PvDS or PcAJ. Parasite densities of PvDS and PcAJ are given in (E,F), respectively. An asterisk represents significant differences (P < 0.01) in parasite density in single infections compared with mixed-infections. Cumulative parasite densities are shown in (G–I). The cumulative parasite density of PyCU in single infections were significantly higher than PyCU in mixed-infections with PyAJ and PvDS (G). Similarly, the cumulative parasite density of PcAJ in single infections was significantly higher than in mixed infections with PyCU or PvDS (I). Detailed statistical values relating to significance are given in Supporting Table 1. Experiments were repeated twice, data is from one representative experiment.

