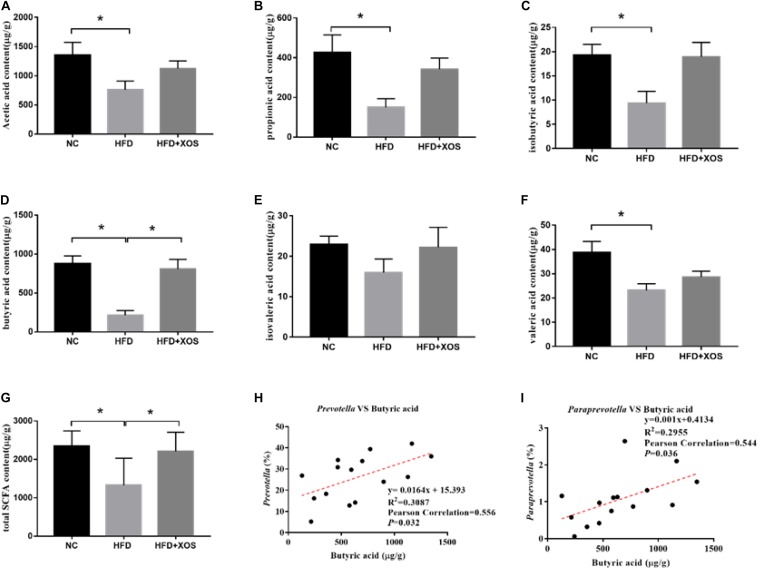
FIGURE 7.
Determination of fecal SCFA content and its correlation with abundance of microorganisms. The levels of acetic acid (A), propionic acid (B), isobutyric acid (C), butyric acid (D), isovaleric acid (E), and valeric acid (F) were determined. The correlation between Prevotella and acetic acid (G), the correlation between Bacteroidetes and acetic acid (H) and the correlation between Lactobacillus and acetic acid (I) were analyzed. Data are given as mean ± SD (n = 5), *P < 0.05.

