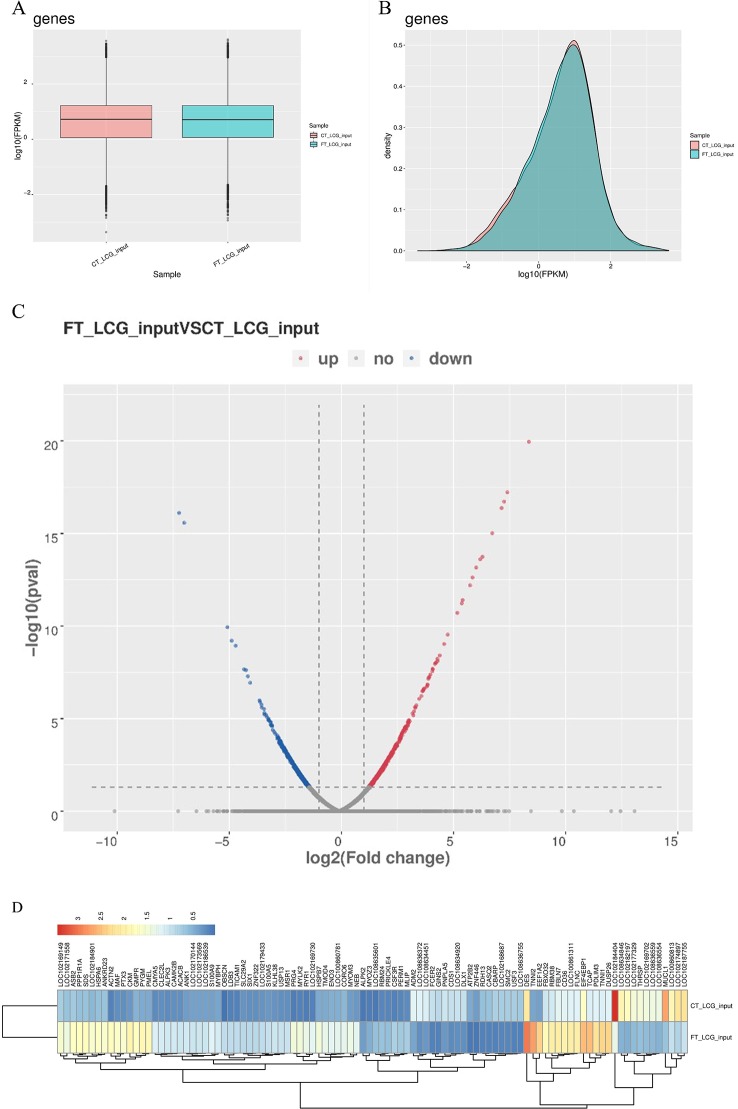
Figure 4.
Overview of differentially expressed genes in goats skin samples. (A) Gene expression box plot. (B) Gene expression density map. (C) Volcanic map of differentially expressed genes. [log2(fold change) was used as the horizontal coordinate, and -log10(p-value) was used as the vertical coordinate. Volcanic map was drawn for all genes in the differentially expressed analysis. The abscissa represents the multiple change of gene expression in different samples. The ordinate represents the statistical significance of differences in gene expression level. Red represents significantly differentially expressed genes up-regulated, blue represents significantly differentially expressed genes down-regulated, and gray dots represent non-significantly differentially expressed genes.] (D) Heatmap of the genes of FT-LCG and CT-LCG.

