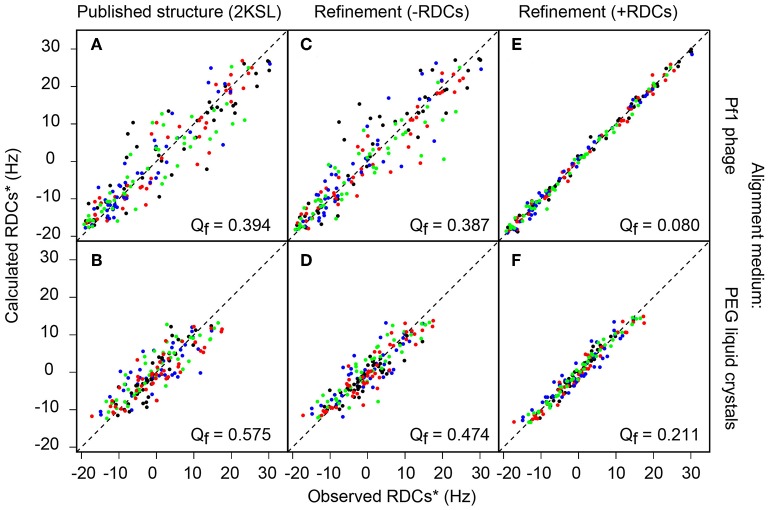
Figure 2.
Plots of experimental vs. back-calculated RDCs using different Ta1a structures. The three columns refer to different structures, the left column (A,B) show data for the published structure, the middle column (C,D) show data for the structure refined here without RDCs and the right column (E,F) show data for the structure refined here using RDCs. The two rows show data using different alignment media (Pf1 phage top and PEG liquid crystals bottom). All RDCs (1DCαHα in green, 1 in red, 1 in blue) are scaled with respect to 1DNH (in black) RDCs.

