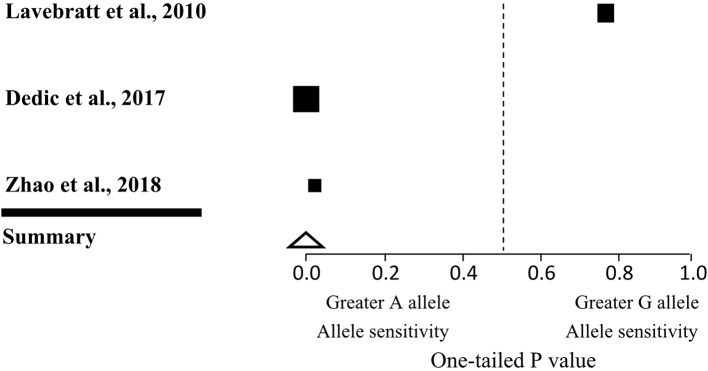
Figure 1.
Forest plot of three human observational studies on the interaction effect of CACNA1C genotype and life stress on depression. Squares indicate the one-tailed P value for each study, with lower values denoting greater stress sensitivity of A allele carriers and higher values corresponding to greater stress sensitivity of G allele carriers. The size of the box reflects the relative sample size. The triangle indicates the overall result of the meta-analysis.

