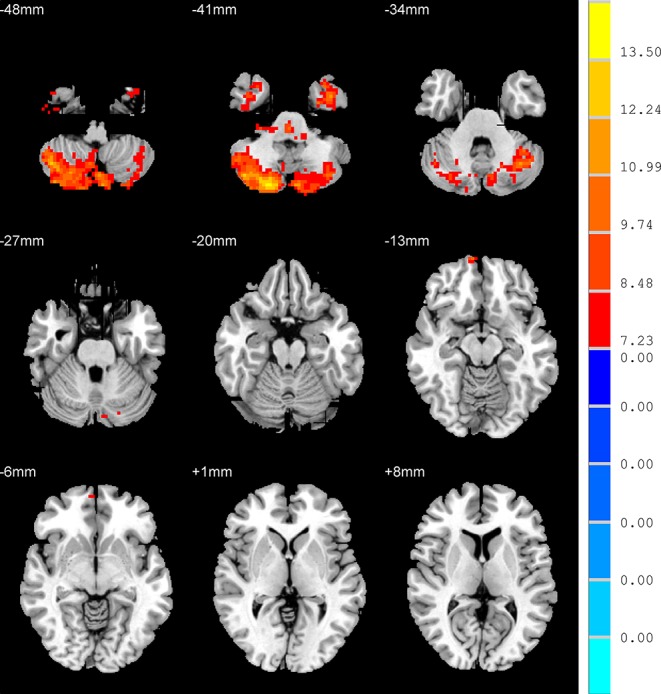
Figure 1.

Brain regions show the differences in the amplitudes of low-frequency fluctuations among the three groups. The color bar signifies the F-value of the analysis of variance analysis with p < 0.001 and corrected for multiple comparisons using AlphaSim.
